Cursor OpenTelemetry Export: What Ships Today, and What You Get Without Enterprise
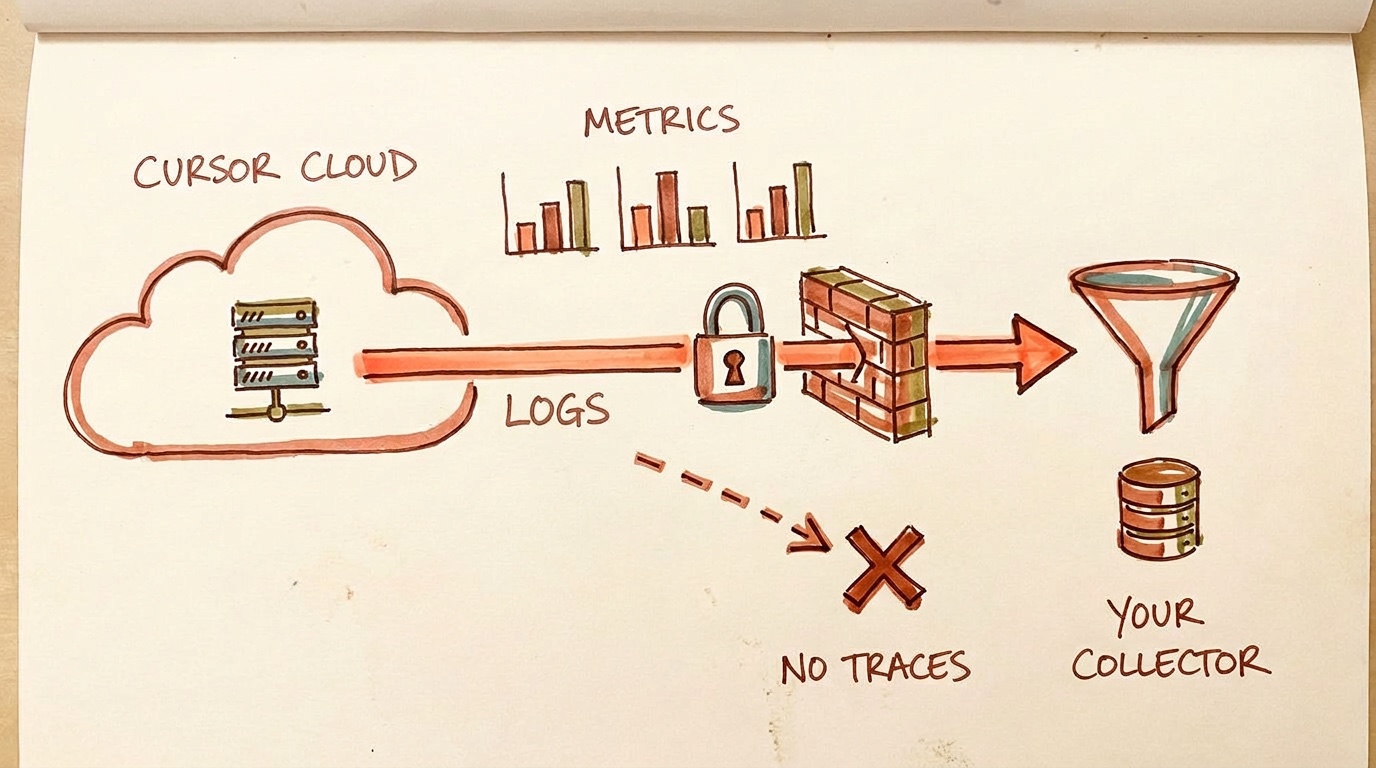
For most of this year the honest answer to “how do I export telemetry from Cursor?” was that you could not, and we said so in a Claude Code OTel post that put “no public knob” in a comparison table. That table is now out of date. Cursor shipped an OpenTelemetry Export. What landed is a real OTLP wire, not a CSV download with a nicer name.
There is a catch, and it is the first thing worth knowing rather than the last: the feature sits behind the Enterprise plan. If you are one developer on Pro looking for a CURSOR_ENABLE_TELEMETRY=1 to put in your shell profile, that still does not exist. So this post covers both readers.
What does Cursor’s OpenTelemetry Export actually send?
Three metrics, all monotonic delta sums:
| Metric | Unit | Attributes that matter |
|---|---|---|
cursor.token.usage | {token} | cursor.token.type (input, output, cache_read, cache_creation), cursor.model.name, cursor.api.status, cursor.api.billable |
cursor.tool.calls | {call} | cursor.tool.kind (builtin or mcp), cursor.tool.name, cursor.tool.status, cursor.mcp.server.name |
cursor.cost.usage | USD | cursor.model.name |
That token breakdown is better than it looks. Splitting cache_read from cache_creation is the single attribute that makes prompt-cache accounting possible. A usage screen that collapses the two into a single “tokens” figure cannot tell you whether caching is earning back its write premium. This wire can.
Alongside the metrics there is a log stream. cursor.api.request is the one carrying per-request numbers: cursor.api.request.input_tokens, output_tokens, cache_read_tokens and cache_creation_tokens, with cursor.model.name attached. Others cover errors, corrections, skill activations, hook completions, plugin installs, and a family of cloud-agent events. Resource attributes identify the team and the user, including cursor.user.email.
Message text and MCP tool arguments are a separate opt-in. Off by default, gated on a team-level toggle and then a per-destination one.
How do I turn it on?
You need to be a team admin on Enterprise. In the Cursor web dashboard, go to Team Settings, then OpenTelemetry Export, and create a destination.
Three details in that form will bite you if you skim:
Give it the base URL with no signal path. Cursor appends /v1/metrics and /v1/logs itself. Paste a URL that already ends in /v1/logs and you get a 404 loop against /v1/logs/v1/logs.
The endpoint must be reachable from the public internet, over HTTPS, from six static addresses Cursor publishes: 3.218.161.44, 3.231.18.206, 35.174.159.35, 184.73.225.134, 3.209.66.12 and 52.44.113.131. This is the constraint that reshapes the whole setup. Cursor is not a local agent phoning a loopback collector. It is a SaaS pushing into your network, so you are standing up a collector with a public ingress and an allowlist, not running something on port 4318 next to your editor.
Auth is a header. Bearer token or API key, stored encrypted on Cursor’s side. Rotating it means editing the destination, and Cursor says the change takes about 30 seconds.
Test the connection, enable it, and data starts flowing within about a minute.
What Cursor will not send you
Six limits, each stated in Cursor’s own documentation rather than inferred by us. They are worth reading before you design a dashboard around this.
- No traces. Cursor does not emit spans. If your model of an agent run is a trace tree with tool calls nested under an LLM call, this wire will not build it.
- No trace context on the logs either. Exported log records carry no
trace_idorspan_id, so you cannot stitch them into spans your own instrumentation produced. - Metrics are at-most-once. Delta sums can show brief gaps after a delivery failure. Your token totals are a close floor, not an exact count.
- Logs are at-least-once. Duplicates arrive. Cursor gives you
cursor.event.idas the dedupe key, and using it is your job, not the collector’s. - Cost is an estimate.
cursor.cost.usageis documented as best-effort and explicitly not billing. Reconcile against the invoice before it becomes a number in a board deck. - Coverage is uneven across surfaces. Conversation content covers cloud agents; the docs say IDE, CLI and desktop conversations are not on that family yet.
Points 3 and 4 together are the ones people get wrong. At-most-once metrics and at-least-once logs means the two streams will disagree about the same period, and neither is lying. If you need one number, derive it from the logs and dedupe on cursor.event.id.
What if you are not on Enterprise?
Then the OTel export is not available to you, and neither is the Analytics API, whose docs say “Only for enterprise teams,” nor the Admin API or the AI Code Tracking API. Four surfaces, one gate.
What is left on the self-serve plans is the Usage page in the web dashboard, with a CSV export. Cursor moved that page to token counts instead of dollar amounts for self-serve plans during 2026, so what you pull down is consumption and not spend. It is a file you download by hand on a schedule you remember, which makes it a reporting surface and not a telemetry pipe.
Two things you may be tempted by, and our honest read on each:
Community OTel hooks. There are open-source projects that wrap Cursor and emit spans from the outside. They are real and some are actively maintained. We have not run any of them, so treat that as unevaluated rather than recommended.
Cursor’s on-disk state. There is a local directory with a tracking database in it. It is undocumented and free to change shape in any release. We did not build against it and would not advise anyone to.
Can TokenJam ingest this?
Not automatically today, and being straight about that matters more than a hopeful answer.
Three concrete gaps, all verifiable in our source:
- There is no Cursor ingest adapter.
core/ingest_adapters/holds Codex, Helicone, Langfuse and generic OTLP. No Cursor. tj serveparses OTLP JSON. Cursor sends OTLP/HTTP protobuf and nothing else. Pointing a Cursor destination at atj serveURL gets you parse failures.POST /v1/metricsontj serveis a stub. It returns 200 and discards the body, which exists so noisy exporters do not fill your logs with warnings.cursor.token.usagewould land there and vanish.
The documented bridge is an OpenTelemetry Collector in the middle. Our OTLP backfill docs already say protobuf needs converting via the collector first, and the otlphttp exporter takes encoding: json, so a collector receiving Cursor’s protobuf and re-exporting JSON at tj serve is the shape that should work. We have not run that against a live Cursor destination. Treat it as the path to try and not as a tested recipe. The log stream is the half worth pointing at tj, because cursor.api.request carries the per-request token counts. The metrics half has nowhere useful to land yet.
Claude Code, by comparison, emits from the CLI process on your own machine. That is why a loopback collector works there and why the setup is a handful of environment variables instead of a dashboard form and a public ingress. Different architecture, different plumbing. Claude Code can also be made to emit spans, behind a beta flag it ships. Cursor has no equivalent at any tier.
Common questions
- Is there a CURSOR_ENABLE_TELEMETRY environment variable?
- No. Cursor's export is configured server-side by a team admin in the web dashboard under Team Settings, then OpenTelemetry Export, and Cursor's own infrastructure pushes the data. There is no per-developer environment variable that makes the editor on your laptop emit OTLP, which is the main structural difference from Claude Code's telemetry. If you are looking for something to put in your shell profile, it does not exist.
- How do I export telemetry from Cursor on the Pro plan?
- You cannot use the OpenTelemetry Export on Pro. That feature, the Analytics API, the Admin API and the AI Code Tracking API are all documented as Enterprise-only. What remains is the Usage page in the Cursor web dashboard and its CSV export, which for self-serve plans reports token counts instead of dollar figures. That is a manual download and not a stream, so anything continuous means either upgrading or wrapping Cursor from outside with a community tool we have not evaluated.
- Does Cursor's OpenTelemetry export include traces?
- No. Cursor's documentation states that it does not send traces, and that exported log records carry no trace_id or span_id. You get three metrics and a set of log events. A dashboard built on this can show token and cost totals sliced by model and tool, and it cannot show a trace waterfall of one agent run. If span-level detail is what you need, this wire will not provide it, and correlating these logs with spans from your own instrumentation is not possible through trace context.
- Can I point Cursor's OTel export at a collector on localhost?
- No. Cursor requires an HTTPS endpoint reachable from the public internet and originates the traffic from six static IP addresses it publishes. A loopback or private-network collector will never receive anything. You need a public ingress, TLS, and an allowlist for those addresses, plus the bearer token or API key header you configured on the destination. Plan for a hosted collector rather than something running beside your editor.
- Is cursor.cost.usage the same as my Cursor bill?
- No, and Cursor says so. The documentation describes the cost metric as a best-effort estimate and explicitly not billing. It is useful for spotting which models and which teams are driving spend, and for watching a trend week over week. It is not a figure to reconcile an invoice against, or to quote as a finance number without checking it against actual billing first. The token metrics are the firmer ground, with the caveat that delta sums can gap after a delivery failure.
- Why do my Cursor metrics and logs disagree about the same hour?
- Because they have different delivery guarantees, and both are behaving as documented. Metrics are at-most-once, so a failed delivery leaves a small gap in the delta sums and the total reads low. Logs are at-least-once, so retries produce duplicates and a naive count reads high. Cursor provides cursor.event.id on log records specifically so you can deduplicate and build an exactly-once view. If you need a single authoritative number for a period, derive it from the deduplicated logs rather than the metric.
Further reading
- Cursor’s OpenTelemetry Export documentation. The primary source for every claim in this post, including the wire reference with the full attribute list.
- Claude Code OTel: what the wire emits. The other side of the comparison, where telemetry comes out of the CLI process instead of the vendor’s servers.
- Prompt caching read vs write cost. Why the
cache_readandcache_creationsplit oncursor.token.usageis the attribute worth keeping.
TokenJam is a local-first, OTel-native cost layer for AI agents. No cloud, no signup. pipx install tokenjam, then tj serve to receive OTLP from the coding agents that do emit it locally.