Instrument Your AI Agent, Then Find Where the Money Goes
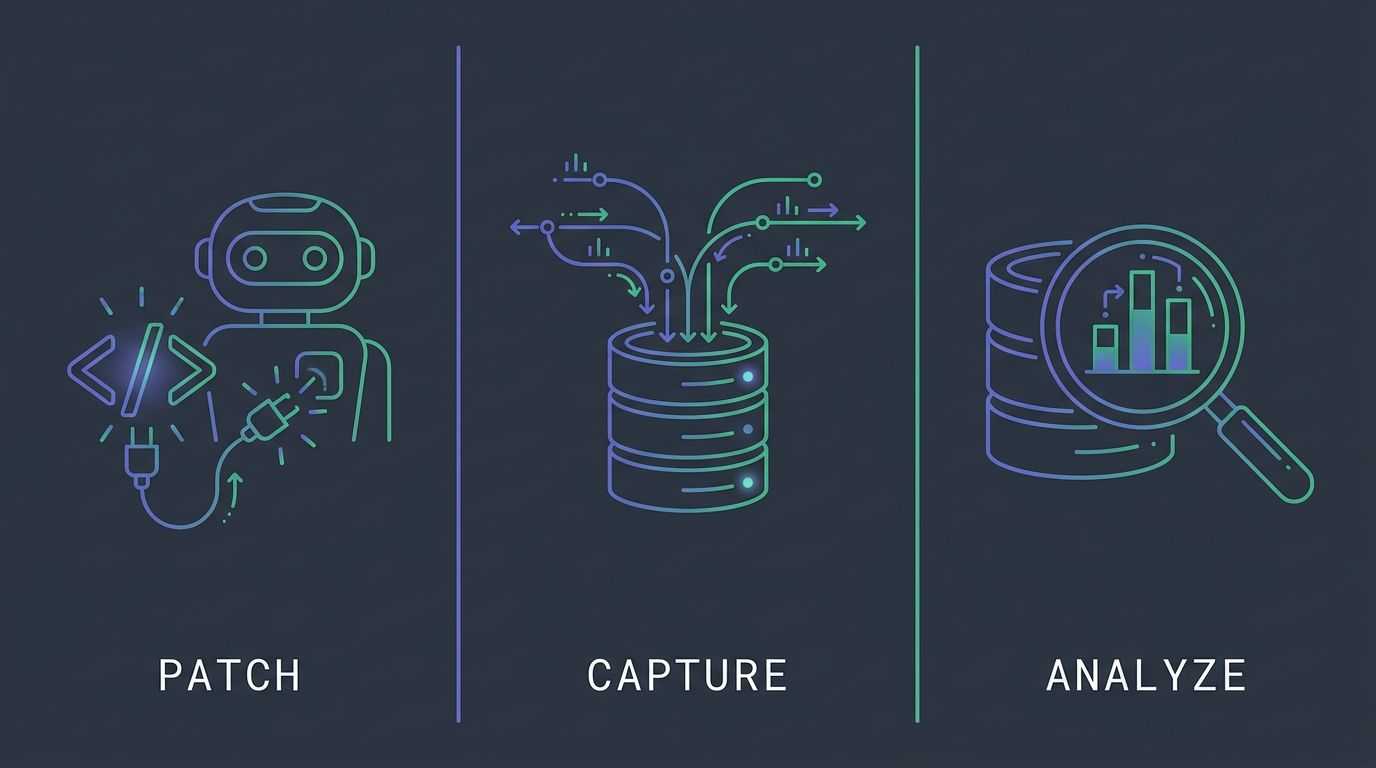
You wire up an agent against two or three provider APIs and ship it. A month later the spend is up and you can’t say why. The Anthropic console shows one figure, the OpenAI dashboard shows another, and neither knows that your planning step calls Opus 40 times a run or that one tool loop retries three times on a bad parse. The bill is a single number with no seam you can pull on. The fix is boring and it works: capture every call locally where it happens, tag it with which agent and which step made it, then let something read those traces back and tell you where the dollars actually went.
That capture-then-analyze loop is what the TokenJam Python SDK is for. This walkthrough is the Python path, start to first finding.
The loop
Two moves. First, a one-line patch wraps your provider client so every LLM call emits a trace span with its model, token counts, and measured cost. Those spans land in a local DuckDB file on your machine. Nothing leaves the box. Second, once you have a few real runs recorded, you run analyzers over that on-disk data. Each one reads the traces and returns a concrete, priced change you can make.
Capture is cheap and always on. Analysis is on demand, and it works against telemetry you already have sitting on disk. If you want the background on why traces (not logs) are the right primitive for agents, I wrote that up in what is agent observability and, on the standard itself, OpenTelemetry for AI agents.
Install and onboard
pipx install tokenjam        # or: pip install tokenjam
tj onboard
tj onboard sets up the local store and walks you through a couple of prompts, including which provider you’re on so cost renders in the right frame. That’s the whole setup. There’s no account, no key to hand over, no hosted endpoint.
Patch your provider, then wrap your entrypoint
Here is the minimal instrumented agent. The patch call goes once, at startup, before you make any calls:
from tokenjam.sdk import watch
from tokenjam.sdk.integrations.anthropic import patch_anthropic

patch_anthropic()            # auto-captures every Anthropic call

@watch(agent_id="my-agent")
def run(task):
    ...
patch_anthropic() monkey-patches the Anthropic client so every request through it is captured with token usage and cost, no per-call-site changes. @watch(agent_id="my-agent") opens a session span around your entrypoint, so all the calls inside a run get grouped under one agent and one session. When you later look at cost, it rolls up per agent and per step, which is the breakdown the provider dashboard can’t give you.
Swap the patch for whichever provider you use. The shipped provider patches are patch_anthropic, patch_openai, patch_gemini, patch_bedrock, and patch_litellm. If your agent talks to more than one provider, call more than one patch. They compose.
More than five providers
If you route through LiteLLM, one patch covers the lot:
from tokenjam.sdk.integrations.litellm import patch_litellm

patch_litellm()              # 100+ providers through one patch
patch_litellm() captures calls across the 100-plus providers LiteLLM fronts, and it suppresses the inner provider patch so you don’t double-count a call that passes through both layers.
If you build on an agent framework rather than raw provider clients, there are framework patches too, covering langchain, langgraph, crewai, autogen, llamaindex, and openai_agents. Same idea: import the patch for your framework and call it once. The spans include the framework’s own structure.
A note on the TypeScript SDK
If your agent is Node or TypeScript, there’s a separate @tokenjam/sdk package. It works differently, and this walkthrough won’t map to it. The TypeScript SDK is telemetry-only: you emit spans by hand over HTTP to a running tj serve, there’s no auto-instrumentation to patch in, and the analyzers are Python-only. So the one-line-patch-then-analyze loop described here is the Python story. TypeScript users can capture. The finding step lives on the Python side.
From traces to priced findings
Instrumentation on its own gives you an honest local record of what your agent did and what each call cost. That already beats reconciling three provider invoices by hand, and it’s the foundation the rest sits on. The record still isn’t the point. The point is the change you make because of it.
That’s the analyzers. Once you have real runs captured, each one reads your traces and returns a concrete, priced finding. They run from the CLI with a positional argument:
tj optimize downsizeThere are five, and each answers a different “where’s the waste” question:
- Downsize: flags calls a cheaper model would have handled, drawn from your real usage rather than a leaderboard.
- Cache: finds stable prompt prefixes where placing
cache_controlearns roughly 30 to 60 percent off those input tokens. - Trim: identifies low-significance tokens in your system prompt that you’re paying to send on every call. (Trim needs the optional
pip install "tokenjam[bloat]"extra and content capture on, so it’s the one that isn’t free on a default install.) - Script: spots deterministic tool-call clusters that a plain script could do instead of an LLM round-trip.
- Reuse: catches your agent re-deriving the same plan run after run when it could reuse the last one.
Each is tj optimize <name>: downsize, cache, trim, script, reuse (plus cache-recommend). Findings stay honest by design. A downsize candidate is a candidate, not a guarantee, which is why it pairs with a benchmark step before you actually switch. If you want the reasoning behind why a dashboard total is the wrong instrument for this and where an agent’s bill really concentrates, those are their own posts: where your agent bill actually goes and cost dashboards tell you the bill.
Instrument once, and every one of those becomes a report you can run against the runs you already recorded. Start with the patch. The findings follow the traces.
Common questions
- My agent hits Anthropic and OpenAI in the same run. Can I see cost split across both?
- Yes. Call both patch_anthropic and patch_openai at startup. Every call through either client gets captured with its own model and cost, and because your entrypoint is wrapped with the watch decorator, the spans roll up under one agent and one session. So you get a per-provider and per-step breakdown of a single run, which is exactly what the two separate provider dashboards can't give you.
- Does instrumenting my agent send my prompts anywhere?
- No. The SDK writes spans to a local DuckDB file on your own machine and never phones home. There is no account and no hosted endpoint. The SDK also leaves prompt and completion content out by default, so out of the box the record holds token counts, cost, timing, and model names, not the text of your prompts or responses.
- I use LiteLLM to hit a dozen providers. Do I need a patch for each one?
- No. Call patch_litellm once and it captures calls across the 100-plus providers LiteLLM fronts. It also suppresses the inner provider-level patch so a call that passes through both layers is only counted once. If you also patch a provider directly, the double-count guard keeps your totals honest.
- How much overhead does the patch add to each call?
- The patch records span metadata around each call and writes it locally. It does not add a network round-trip, because nothing is sent off the machine. For most agents the capture cost is negligible next to the latency of the LLM call itself.
- I already have telemetry from a previous run. Do I have to re-run everything to get a finding?
- No. The analyzers read the traces already on disk. Once you have a few real runs captured, run tj optimize with the analyzer you want, for example tj optimize downsize, and it works against the recorded data. You instrument once and can run findings whenever you want without re-executing your agent.
- I build my agent in TypeScript. Can I use this same flow?
- Partly. The TypeScript package @tokenjam/sdk can capture telemetry. It's telemetry-only: you emit spans manually over HTTP to a running tj serve, there is no auto-instrumentation to patch in, and the analyzers are Python-only. So a Node agent can record its calls. The one-line-patch and the optimize findings described here are the Python path.