TokenJam Lens
See exactly where your agent tokens go — and what's recoverable — without leaving your machine.
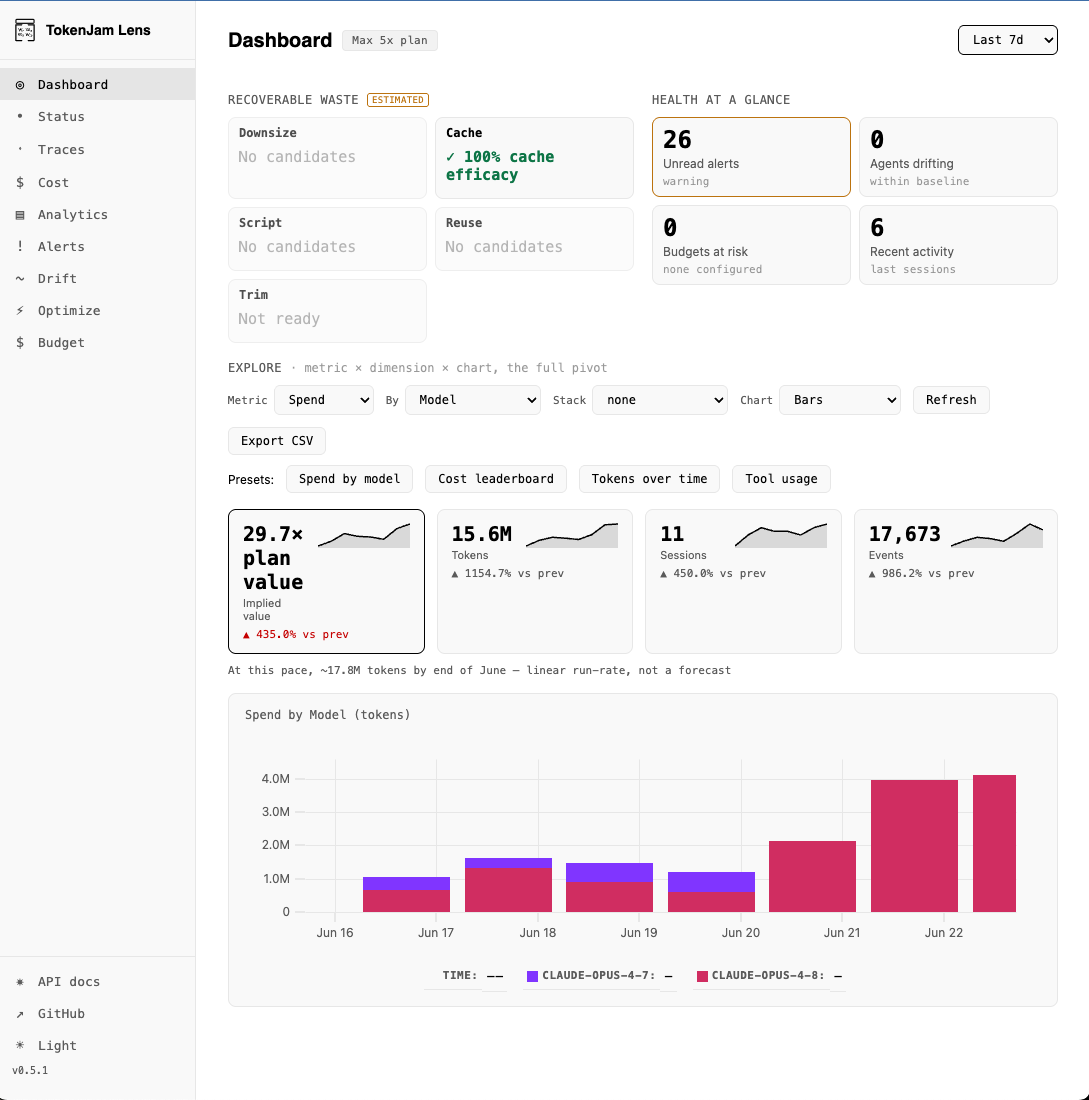
The heart of Lens is its explorer. Pick a metric × dimension × chart and
read that exact slice of your usage. One pivot covers spend by model, tokens over time, or
tool calls by category, with presets and CSV export built in. It's the dashboard
tj serve gives you, running locally with no signup and nothing sent to a cloud.
One chart, every slice
Static cost dashboards give you the views their authors thought of. Lens gives you the pivot. Want spend ranked by model? Two dropdowns. Tool calls over time? Two more. Pick the metric, the dimension, and the chart, and the answer is on screen. Presets like Spend by model and Cost leaderboard jump straight to the common ones, Export CSV hands the same slice to your own tooling, and the Analytics tab opens this explorer full-screen.
Your triage front door
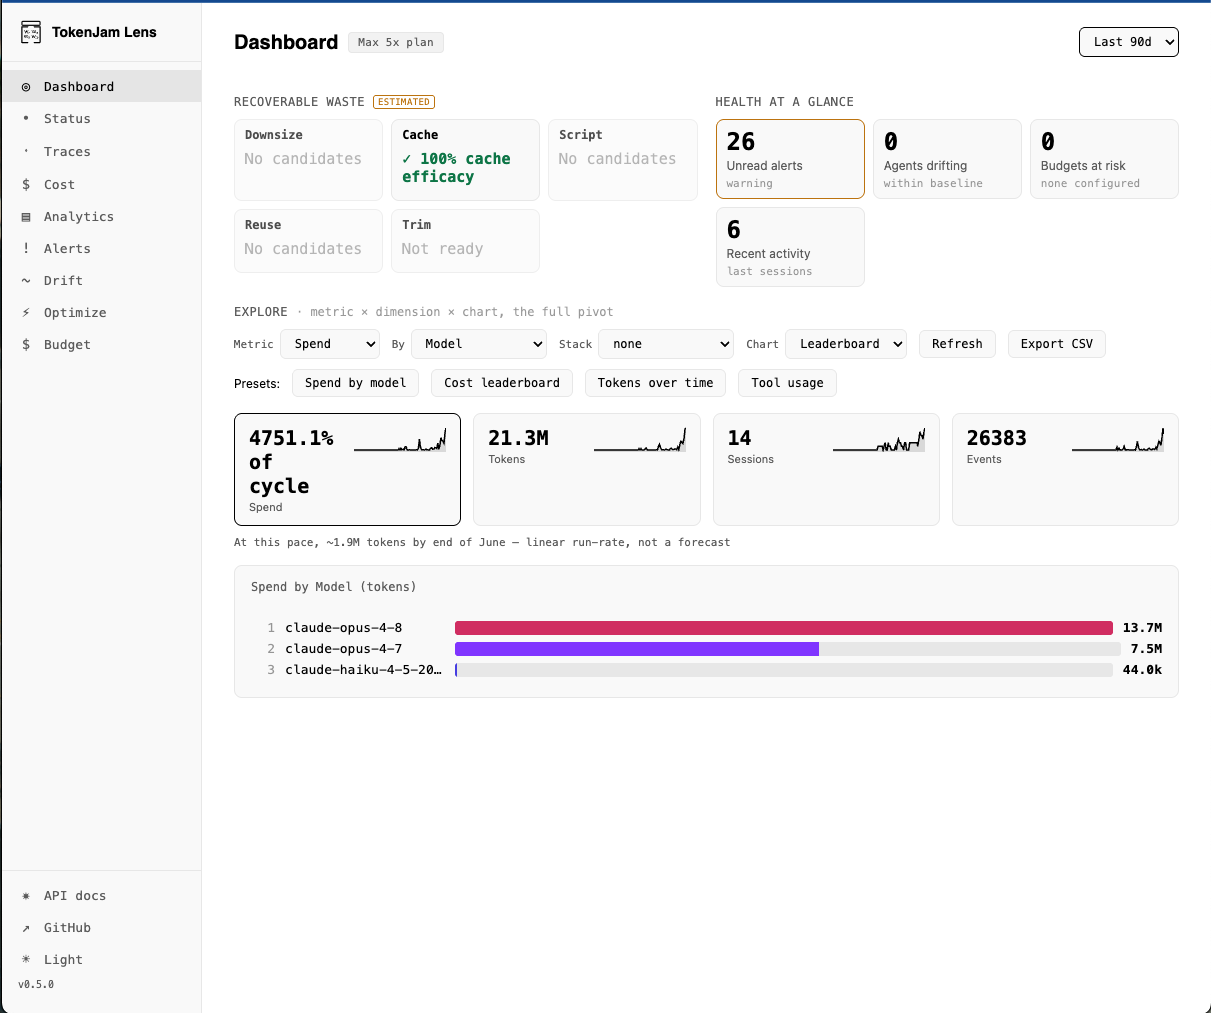
The Dashboard is the default landing view. What used to be a separate Overview page now lives
here, so the first screen answers a simple question: where am I, and what should I look at
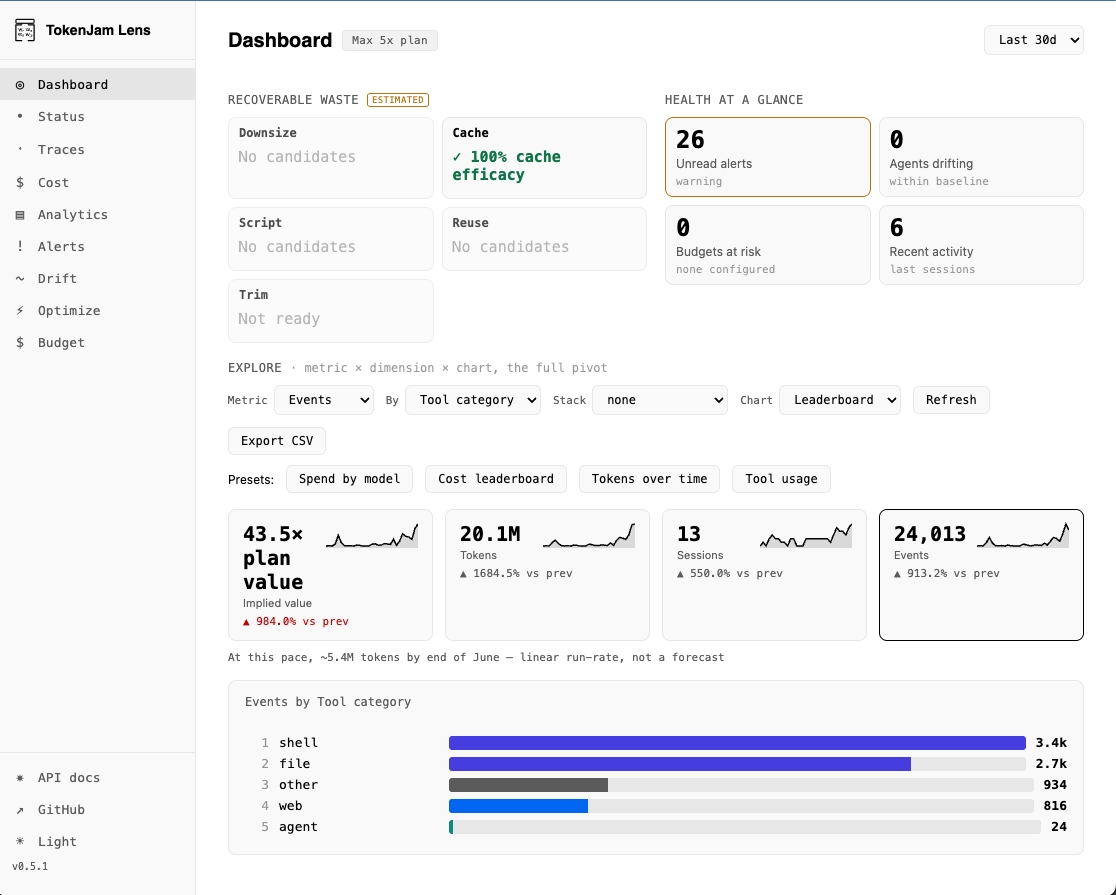
next? A recoverable-waste band carries one tile per analyzer (Downsize,
Cache, Script, Reuse, Trim), each tagged Estimated, each showing its finding or a
clean ✓ 100% cache efficacy when there's nothing to recover. Above it, a health
row tracks unread alerts, agents drifting from baseline, budgets at risk, and recent activity.
Click a waste tile and it expands in place, no page hop, with the explorer sitting right
below. New analyzers show up on their own, since the band is registry-driven.
Cost, with the math shown
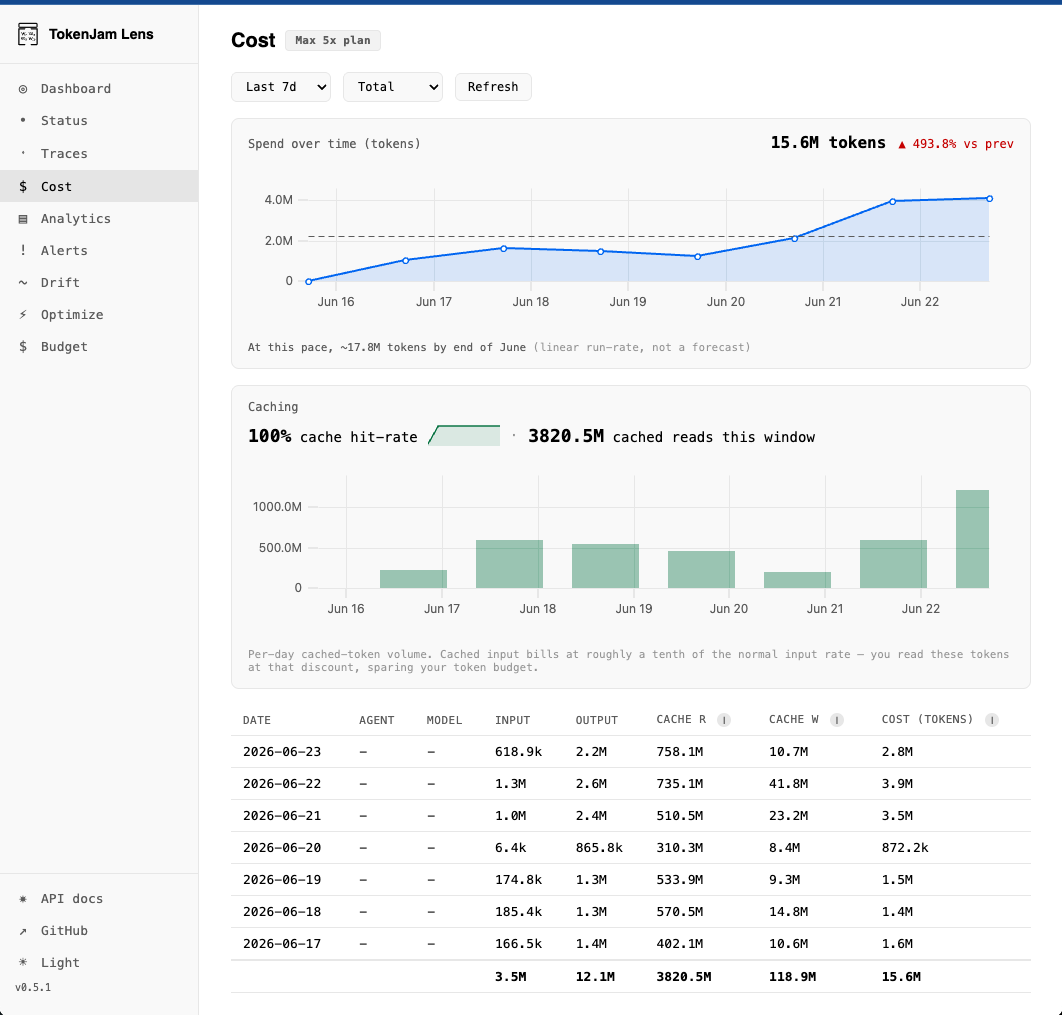
Spend over time as a real chart, paired with a Caching card so a cache-heavy
window stops being a mystery. You see the hit-rate, the cached reads, and how much cached
volume ran each day, with a note that cached input bills at about a tenth of the normal rate.
The per-day table breaks the numbers down by agent or model: input, output, CACHE R,
CACHE W, total cost. Projections carry the caption
"linear run-rate, not a forecast." Lens never claims to predict.
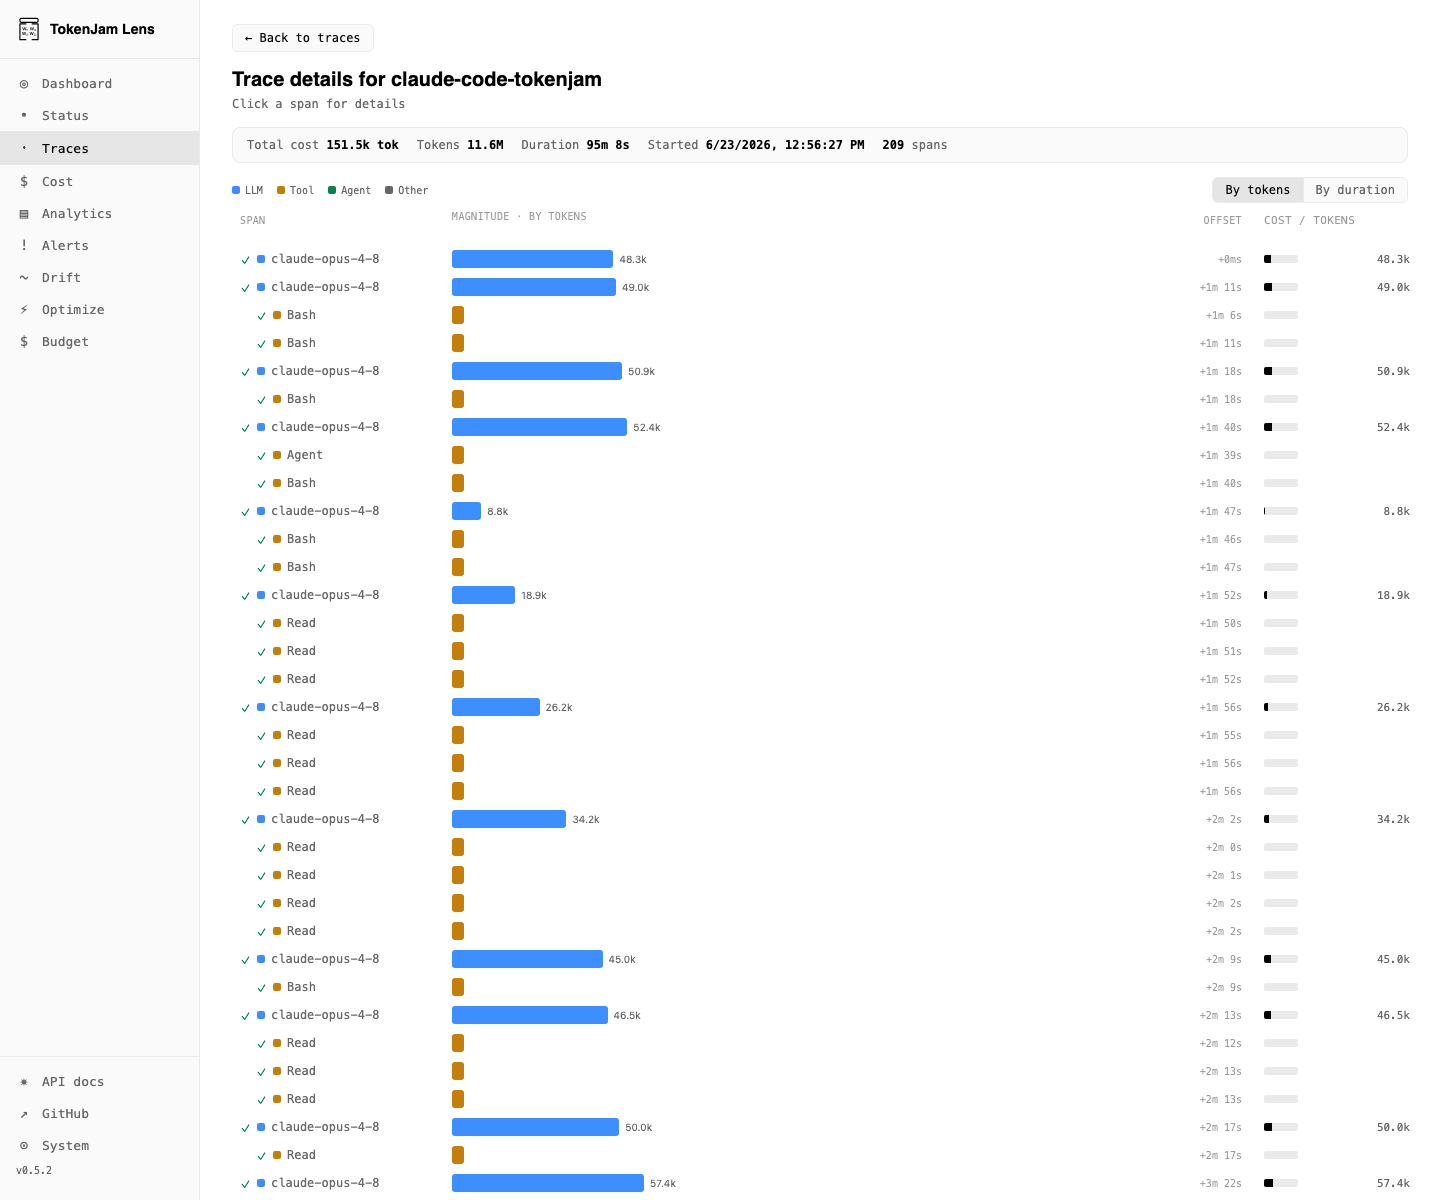
Trace any session down to the span
Open a session for the cost-annotated waterfall. Every span is laid out by magnitude, toggleable by tokens or by duration, with a per-span cost column down the side. Hover a span and the call detail comes up: provider, model, input and output tokens, cache read and write. The one expensive span in a long run stops hiding.
Get started
No signup, nothing to configure. tj onboard backfills your last 30 days of
Claude Code sessions, so the dashboard opens at 127.0.0.1:7391 already full of
your own data.
$ pipx install tokenjam
$ tj onboard --claude-code
  → backfills your last 30 days of Claude Code sessions
$ tj serve
  → open http://127.0.0.1:7391/
Curious where you'd land? Are you TokenMaxxing hard enough? finds your tier in under a minute. Source on GitHub, full Web UI reference in the docs.