Where your agent bill actually goes (and why most of it isn't buying useful work)
Why this matters today. GitHub Copilot moved to usage-based billing this morning. Anthropic’s programmatic credit cap takes effect in two weeks. Microsoft is cancelling Claude Code licenses across its Windows, M365, and Surface engineering org, Uber burned its entire 2026 AI budget in four months, and OpenClaw produced the now-famous $1.3M screenshot. The previous post laid out those headline cost shocks in detail. This one is the forensic follow-up: where exactly does the money go in a typical agent workload, and why is most of it not buying useful work?
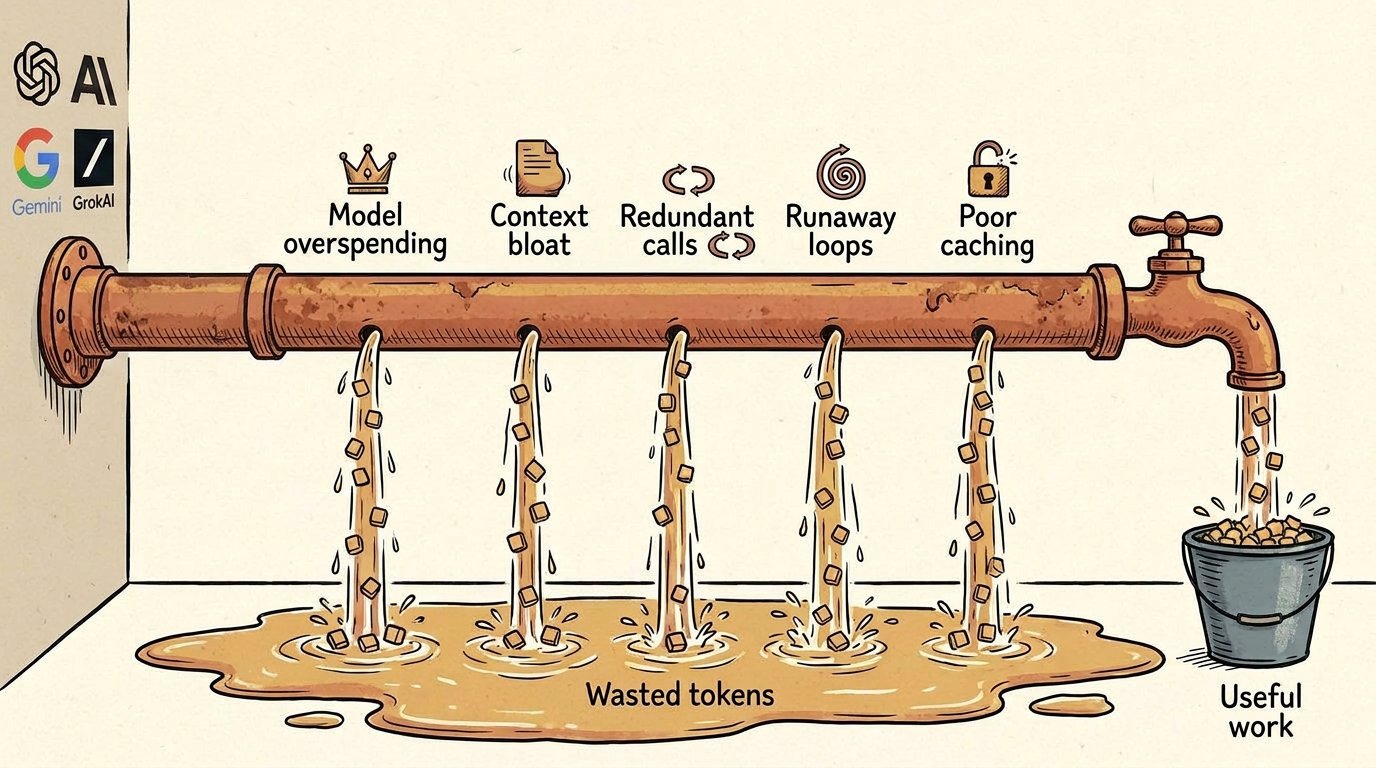
The honest summary is that agent token spend has a small number of recurring failure modes. The same patterns show up in coding-agent workloads, research-agent workloads, customer-support pilots, autonomous data-pipeline runs. Knowing the patterns is the difference between staring at a $1.3M bill and being able to point at the specific lines that should not exist.
1. Model overspending
Using a model that is larger and more expensive than the task requires. A team standardizes on Claude Opus or GPT-5 for everything, including small classification calls, simple routing decisions, and short reformulations that Claude Haiku or GPT-5-Nano would handle equivalently. The factor is 5-10× on price-per-token, applied to the share of the workload that didn’t need the bigger model.
This pattern is universal. Cost spreads between the lightest and heaviest users of the same coding agent routinely run an order of magnitude or more: same access, same tool, 10-20× the bill. Some of that gap is workload volume, but a meaningful chunk is model choice: heavy users tend to default to the strongest model on every call, including for tasks where a cheaper model would handle the work equivalently.
The technique that addresses it. Model cascading. Try the cheap model first; escalate to the expensive model only when the cheap model fails or returns low-confidence output. Stanford’s FrugalGPT framework (Chen, Zaharia, Zou, 2023) showed this approach can match GPT-4 quality at up to 98% cost reduction on some workloads. RouteLLM (LMSys, ICLR 2025) extended the idea with a matrix-factorization router that learns from preference data and transfers across model pairs without retraining; it achieves 95% of GPT-4 performance with 26% GPT-4 calls. BudgetMLAgent (2024) showed 94% cost reduction on agent tasks using cascaded orchestration: cheap model for most calls, escalate only on failure.
The hard part is not the technique. The hard part is knowing which of your workloads is actually safe to downgrade. That requires looking at the user’s own session history, not generic benchmark data.
2. Context bloat
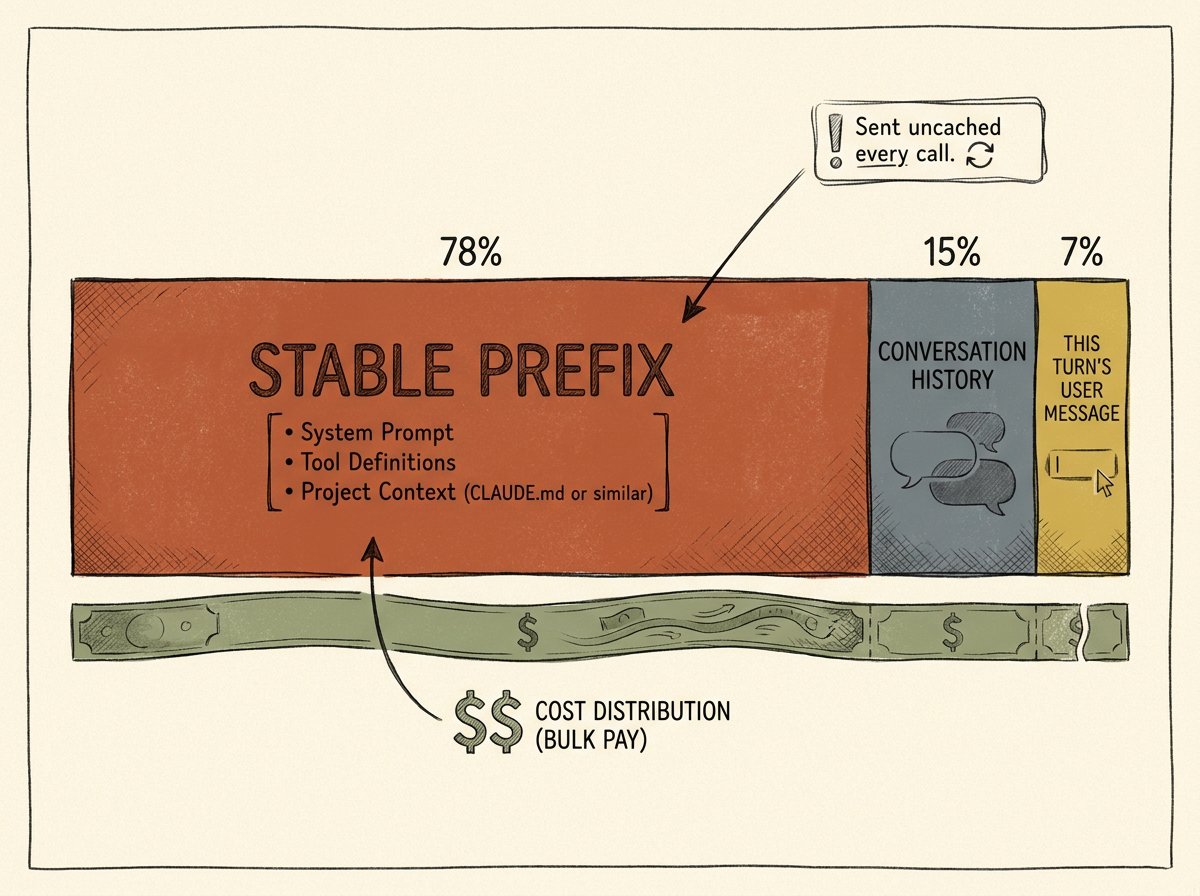
System prompts, tool definitions, and project context that grow over time without governance. A CLAUDE.md file that started at 500 tokens balloons to 4,000 as teams add safety guidelines, edge-case handling, and “don’t forget to do X” reminders. Every single call in every session of every day pays the full cost of the bloated prompt.
This is often the largest single pattern in production. A typical agent session sends thousands of tokens of project context, system prompt, and tool definitions on every single turn: not retries, not reasoning chains, not output tokens. Most of those tokens are not doing useful work; they are retransmitting the same text repeatedly across calls. Anthropic’s prompt-caching pricing makes the cost gap explicit: cache reads are 10% of normal input-token cost, and a stable prefix that’s reused dozens of times in a session pays roughly an order of magnitude more than it should if no cache_control breakpoint is configured. Most production users haven’t configured one.
The technique that addresses it. LLMLingua-2 (Microsoft, ACL 2024). The technique reframes prompt compression as a token classification problem: train a BERT-class model, distilled from GPT-4, that scores each token’s contribution to the response. Tokens scoring low can be removed without measurable quality loss. The model is MIT-licensed and runs on CPU. Microsoft’s published benchmarks showed up to 20× compression on GSM8K and BBH while preserving in-context-learning quality, with 3-6× faster inference than the original LLMLingua.
The technique exists. The work is in identifying which parts of the user’s actual prompts carry signal and which are repetition. A 4,000-token CLAUDE.md isn’t always bloated. The 4,000-token CLAUDE.md that shows the same 1,108-token section in 91 of 247 sessions, with only 340 tokens of that section actually contributing to responses, is.
3. Redundant calls
The agent asks the same question twice in five minutes. A tool returns a result, the agent processes it, then asks a follow-up question whose answer was already in the previous tool call. Or the agent calls the same API twice to fetch data it already retrieved earlier in the session. These show up as paired calls with high prompt similarity within a short window.
The pattern is harder to see than model overspending or context bloat because it lives inside the agent’s reasoning trajectory rather than the prompt structure. But it accumulates. A coding agent that does 12 redundant Read calls per session, multiplied across hundreds of sessions per developer per month, becomes a meaningful share of the bill.
The technique that addresses it. Agentic Plan Caching (June 2025, presented at NeurIPS 2025). The published technique extracts reusable program templates from successful trajectories: when the agent has solved a task once, the plan it followed becomes a candidate for reuse. New requests that match the cached plan’s signature reuse it with a lightweight model, escalating to the high-capacity planner only on cache miss. The paper reports a 50% cost reduction and 27% latency reduction on average across multiple real-world agent applications. Combined with semantic caching at the call level (GPTCache, Zilliz 2023, cosine similarity at 0.8 threshold), the same approach catches both plan-level redundancy and call-level redundancy.
4. Runaway loops
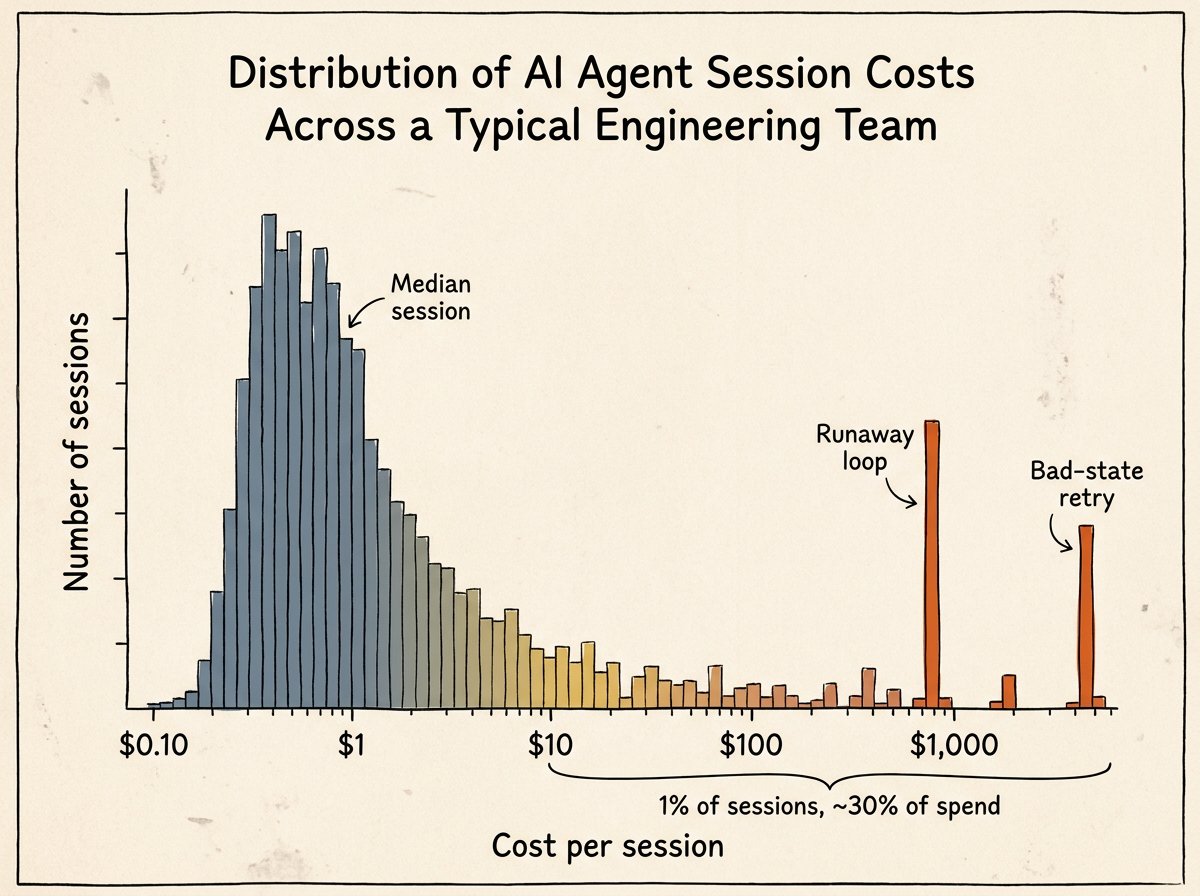
The agent fails to complete a task, retries, fails again, retries again, and continues until a budget cap or timeout interrupts it. A flaky external dependency, a malformed tool response, a session that wandered off its objective and is now thrashing in a corner. Without a budget signal that the agent can actually see, the agent has no reason to stop.
The Steinberger / OpenClaw $1.3M screenshot is the public face of this pattern at scale: a small fleet of Codex instances ran near saturation for 30 days, much of that consumption produced by sessions that should have terminated sooner. The same shape, at smaller scale, is the single developer who kicks off an autonomous refactoring session on a Friday afternoon and wakes up Monday morning to a four-figure weekend bill from an agent that spent 60 hours retrying through a bad state. Without a real-time budget signal that the agent itself can see, the agent has no way to know it has gone wrong.
The technique that addresses it. Budget-Aware Tool-Use (Google + UCSB, November 2025). The paper introduces a “Budget Tracker,” a lightweight plug-in that surfaces the agent’s current cycle budget back to the agent itself as a numerical signal it can reason over. On the BrowseComp benchmark, the budget-aware approach achieved comparable accuracy with 40.4% fewer search calls, 19.9% fewer browse calls, and a 31.3% overall cost reduction. The agent that knows it is at 68% of its budget can decide to terminate early; the agent that doesn’t know, can’t.
This is the cleanest case of “the research is years old, the technique is straightforward, no one ships it as a product.” A budget signal that the agent can query directly during execution is genuinely missing from most production agent setups.
5. Poor caching
Results that should be cached are recomputed. A system prompt or tool definition that’s identical on every call is sent at full input-token cost every call rather than at the cached read rate. Anthropic charges 10% of the normal input-token rate on cache reads and 25% extra on the cache write; the math is straightforward, and most production users are leaving 30-60% of their input cost on the table because they haven’t configured cache_control breakpoints correctly.
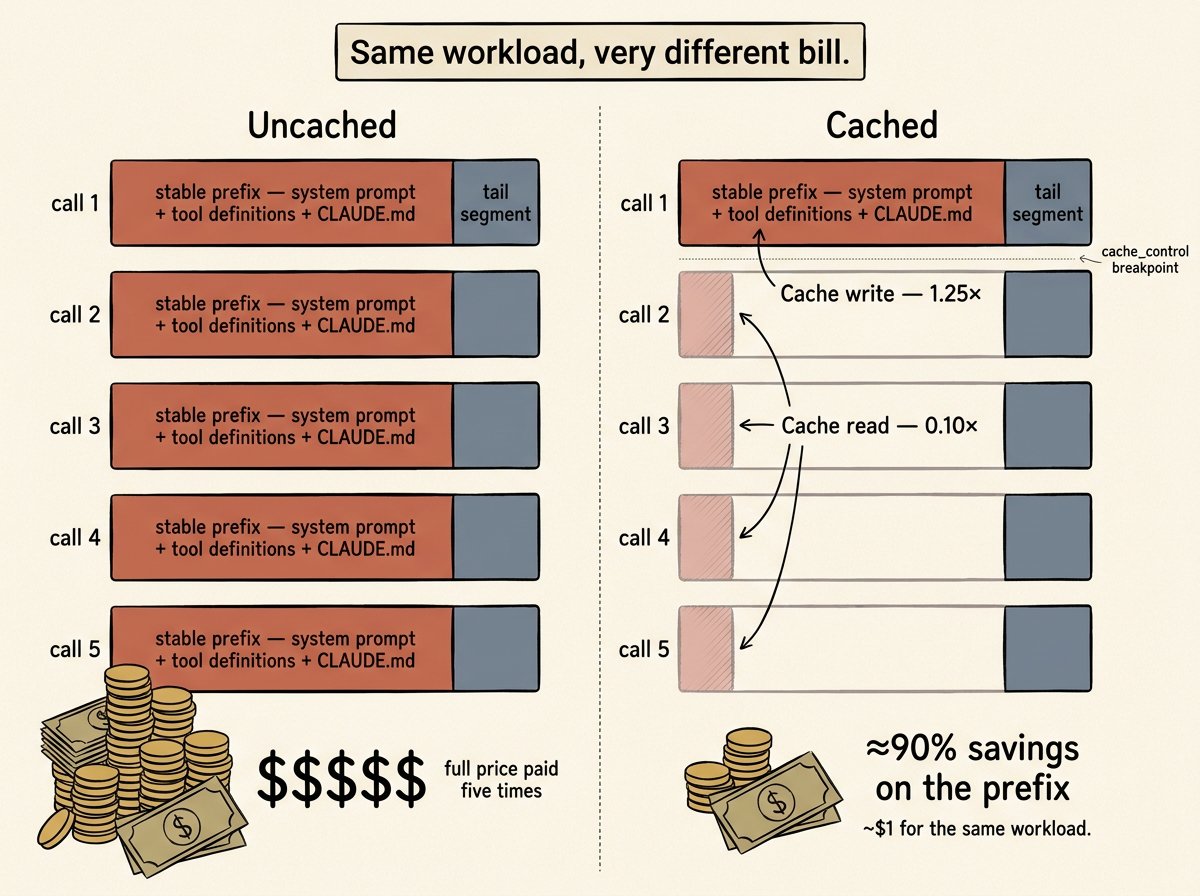
For Claude Code specifically, the data is right there in every JSONL session log: cache_read_input_tokens and cache_creation_input_tokens appear in the usage block of every assistant turn. A user who is paying full price on a stable 2,400-token prefix across 94% of their calls is leaving substantial savings unclaimed.
The technique that addresses it. Provider-native prompt caching (Anthropic, OpenAI, Google all support some version). The detection step is straightforward: walk the prompts in the window, compute prefix hashes at common breakpoints, identify identical prefixes occurring within the cache TTL. Where there’s a long, stable prefix being sent at full price across many calls, the cache_control placement recommendation is direct. For workloads with high prompt similarity but not byte-identical prefixes (customer-support FAQs, query reformulations), GPTCache-style semantic caching at the application layer is the appropriate next step.
The pattern across all five
The same shape applies to every category above. The technique exists in published research, often for two or three years. The technique works on test workloads in the lab. The technique is implemented as a library or a research artifact. And no product runs the technique against a real user’s actual workload data and tells the user, specifically, where to apply it.
Each of the five patterns is a place where the gap between “what we know” and “what teams have shipped” is wider than it looks. Combined, the patterns are why a coding-agent bill ends up 3-5× what the team budgeted, why Uber burned its annual budget in four months, and why most production teams are paying full input-token rates on context that should have been cached after the first call.
What’s missing isn’t theoretical capability. The papers are public, the code is on GitHub, the techniques compose. What’s missing is the operational surface: a tool that ingests a team’s actual telemetry, runs the analyses, and produces a ranked list of specific, evidence-backed changes that team should make this week.
Common questions
- How do I check my own usage for these patterns?
- The cheapest first pass is to look at three numbers. Total token count by model across your last 30 days. Cache-read ratio (cache_read_input_tokens divided by total input tokens) if your provider exposes it. And cost-per-session distribution, where a fat tail of expensive sessions is a strong indicator of runaway loops. Claude Code users can read these directly from ~/.claude/projects/<project>/<session>.jsonl; OpenAI users can pull them from the Usage console.
- What's a realistic savings range from addressing these?
- It depends heavily on the team's current discipline. Teams with severe context bloat and frequent redundant calls can save 50-70% on token cost without changing models. Teams that have already optimized carefully might recover 10-20%. Model cascading is often the largest single lever when a team is using a flagship model for everything: 3-10x cost reduction on the share of work that doesn't need the flagship.
- Doesn't observability already tell me this?
- Observability tools give you visibility into what happened. They don't run the analyses described above against your data. A Langfuse or Helicone dashboard will tell you how much you spent on Opus last week; it will not tell you that 47% of those Opus calls would have completed on Haiku, or that your system prompt has grown 38% in 30 days with 60% of the new content not contributing to responses. The cost dashboard is the substrate. The recommendation engine that sits on top is a different layer of the stack.
- Why do all the techniques cited come from research papers, not shipping products?
- The techniques themselves are not commercial moats; they're known and the code is mostly published. The commercial work is in the operational layer: capturing the telemetry, normalizing across multiple agent runtimes, running the analyses against real workloads, validating recommendations on the user's own data before recommending them, and surfacing the findings as specific actionable changes rather than abstract metrics. That layer is what's missing in production.
- What about subscription users on Claude Code or Codex who pay a flat rate?
- The token consumption is the same; the bill structure is different. A user on Anthropic's Max 20x plan does not see a dollar figure saved per month because they're on a flat rate. They see cycle headroom freed. The cap structure starting June 15 turns those tokens into real cost once the credit pool is exhausted. The patterns are the same; the way the savings show up depends on the plan.