Missing Token Counts on Streamed LLM Calls (and Why Your Spend Total Reads Low)
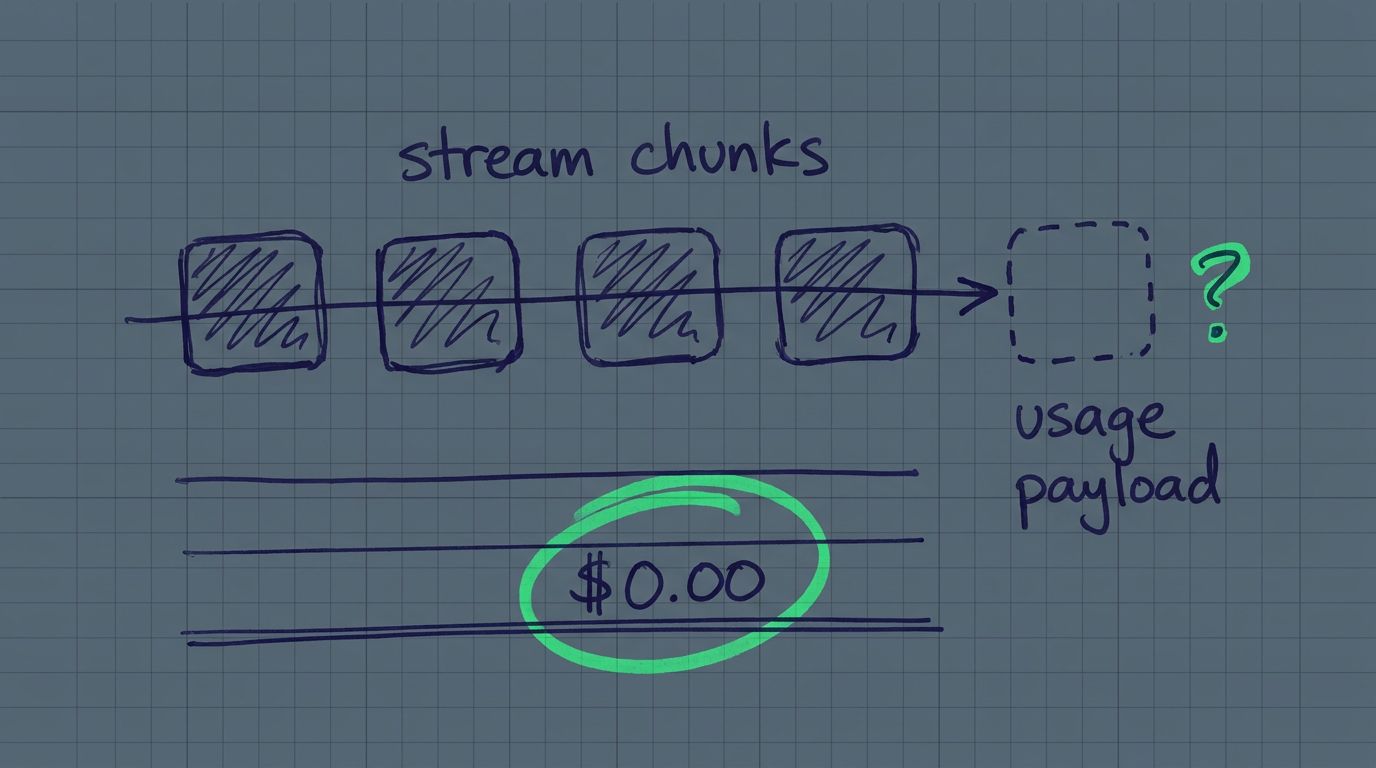
Take an agent that made 900 streamed calls last week, with a spend total built on token counts. Say 40 of those calls never reported a token. (Those numbers are made up for the sake of the arithmetic; I have no idea what share of your traffic this touches, and neither does anyone else.) The total is now the sum of 860 calls wearing the label of 900. Nothing flags it as partial. It is simply lower than the truth, and every figure derived from it inherits the gap.
This is a data-quality failure that looks exactly like good news. A cheaper total is the thing everyone is hoping to see.
What makes a streamed call report no tokens?
Non-streamed calls are easy. The response body carries a usage object, you read it, you are done.
Streaming is different. The provider does not know the output token count until the generation finishes, so it cannot put usage in a header or an early chunk. It sends the numbers at the end, in a final payload, as a separate event after the content is done.
Two mechanics follow from that, and both of them fail quietly.
On Anthropic, usage arrives in the trailing message_delta. A stream that runs to completion always reports it. A stream the caller walks away from never reaches that event. If your handler breaks out of the iterator early, or raises, or forwards chunks to a browser tab that the user closes halfway through a long answer, the generation still ran and the provider still billed it. Your side just never received the accounting.
On OpenAI-compatible APIs, usage is opt-in. The final usage chunk is emitted only when the request carried stream_options={"include_usage": true}. Without that flag, the API emits no usage payload for a streamed response at all. Not a partial one. None. And because the usage chunk is the last one and carries an empty choices list, it only arrives if something drains the iterator to the end.
So the failure has two independent causes. One is a missing request field. The other is a connection that ended early. The second is the harder one, because it is a function of your users’ behaviour and not of your code, and it gets worse as responses get longer.
Which totals lose the call, and which do not
Here is the part that makes the gap hard to notice.
A call with no token counts is not an error. The span is written, the trace is intact, the status is fine. What it lacks is numbers. And a cost function given zero input tokens, zero output tokens, zero cache reads and zero cache writes returns zero dollars without a warning, because for every other call in your corpus that is the correct answer.
That split is the whole problem:
- Anything summing cost or tokens loses the call. Window spend, per-model cost, per-agent cost, cost per session, anything with a dollar on it. The call contributes exactly nothing.
- Anything counting rows keeps it. Call counts, span counts, session counts, request volume, latency percentiles. The call is right there, present and accounted for.
Your dashboard therefore reports more calls at less money, which reads as efficiency. The arithmetic is internally consistent. It is consistent about the wrong population.
How do I tell whether I have this gap?
You need something watching the streams, because the evidence lives in the shape of the observation, not in the recorded numbers. A span with no tokens tells you nothing by itself. A span with no tokens that was a stream and did produce content is a different fact entirely.
That is what the detection is built on. Every code path in TokenJam that observes a stream stamps three attributes at observation time: whether the call was streamed, whether a usage payload arrived, and how many content chunks went past. The SDK provider patches do it, and so does the pass-through proxy’s SSE tap. Three states come out of that, and the analyzer only flags the third:
- Not a stream at all. Ignored.
- A stream that reported usage. Used as the baseline (see below).
- A stream that produced content and then closed with no usage payload. Flagged.
The third condition carries a deliberate extra clause: content chunks must be greater than zero. A stream that opened and delivered nothing cost nothing to under-count, and counting those would pad the gap with noise.
Then run it:
pipx install tokenjam

# instrument the client that makes the streamed calls
python -c "from tokenjam.sdk import patch_openai; patch_openai()"
# ...or route the traffic through the local proxy instead
tj proxy

# then, after some traffic has landed
tj optimize stream-usage
tj optimize stream-usage --json   # full per-call-site detail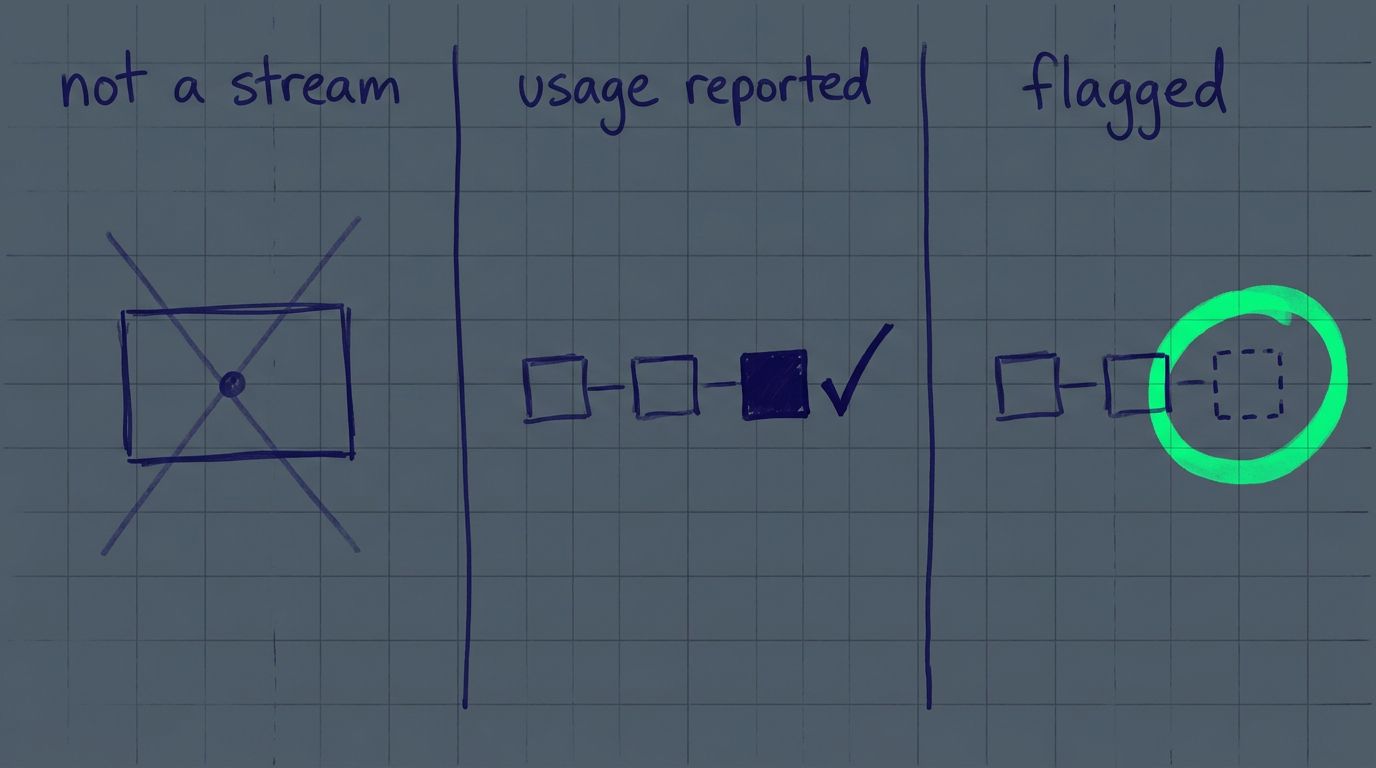
If no streamed call was observed in the window, the output says so instead of reporting a clean bill. “No streams seen” and “no gap” are different answers and it will not conflate them.
How is the missing spend sized?
Carefully, and with the uncertainty on the surface.
Affected calls are grouped per call site: provider, model, agent. Each group’s missing calls are sized at the median per-call token usage of the completed streams for the same model in the same window, broken out across input, output, cache-read and cache-write, then priced at that model’s rates. So the estimate is built from your own traffic, not from an assumption about typical response length.
Three rules keep that from turning into a confident lie.
No baseline, no figure. If a call site has no completed stream to learn from, or the affected calls carry no model name to price against, no dollar figure is claimed. The field renders empty. Printing $0.00 there would read as “no blind spot,” which is the exact thing the analyzer exists to contradict.
Token-less observations are excluded from the median, not counted as zero. The proxy’s SSE tap watches bytes on the wire, where the provider’s usage accounting does not live, so it can watch a stream complete and still never learn its numbers. Those are counted and reported separately (“N completed streams carried no token counts”), and left out of the median. Admitting them as zeros would drag the median toward zero and produce a confident tiny figure for a gap nobody measured.
The figure is labelled estimated every time it renders. The real counts for these calls were never reported by the provider and never will be. What the tool knows for certain is the count of affected calls. The dollar attached to them is derived.
Why this is not a saving
Every other analyzer in tj optimize answers “what could you stop paying for.” This one does not, and the distinction is load-bearing enough that it is enforced in two places instead of written down in a comment.
The finding is absent from the cost-proposal registry, and it carries no past_overspend_* field. Those are the only two mechanisms that pull a dollar figure into the recoverable-waste rollup, so neither can reach it. The note printed with the finding says it in plain words: the money was already spent and the provider already billed it. Capturing the usage payload makes your figure correct. It does not make it smaller.
Expect your total to go up when you fix this. That is the fix working.
The fix, per provider
OpenAI-compatible APIs need the flag and the drain:
stream = client.chat.completions.create(
    model=model,
    messages=messages,
    stream=True,
    # Without this the API emits NO usage payload for a streamed response.
    stream_options={"include_usage": True},
)
usage = None
for chunk in stream:
    # The usage chunk is the LAST one and carries an empty `choices` list, so
    # it only arrives if the iterator is drained. Consume the stream here,
    # server-side, rather than handing it to a client that may disconnect.
    if chunk.usage:
        usage = chunk.usage
Anthropic needs only the drain:
with client.messages.stream(model=model, messages=messages) as stream:
    for event in stream:
        ...  # forward to your caller
    # Only reachable once the stream has been drained; a caller that
    # disconnects mid-response never gets here, so consume the stream
    # server-side and forward from what you have already accumulated.
    usage = stream.get_final_message().usage
The shared shape of both fixes is that the server consumes the stream to completion and forwards from what it has accumulated, instead of handing the provider’s iterator straight to a client whose connection it does not control. That is a small architectural change with a large accounting consequence.
A note on who this applies to
stream-usage is gated off for the interactive-coding-agent persona, and that is a decision, not an oversight.
TokenJam classifies each analysis window by its dominant persona from the agent mix in the window, falling back to your declared plan tier when no session carries an identifiable agent id. For a claude-code window the analyzer does not run. The harness builds the API request and drains its own streams, so the failure mode does not arise, and the fix would sit on the wrong side of what the user can actually change. It runs for sdk, mixed and unknown windows, which is where someone’s own code constructs the provider call.
If you are instrumenting your own agent or service, this is your analyzer. If you only run Claude Code, it will not appear in your report, by design.
Common questions
- My token totals look lower than my provider invoice. Is this why?
- It is one candidate worth ruling out first, because it is cheap to check and silent by construction. Look at whether your streamed calls carry token counts at all. If a meaningful number of calls in your own telemetry have zero input and zero output tokens while still appearing in your call count, you have this gap. Other candidates are unpriced models falling back to default rates and traffic that never reached your telemetry in the first place.
- Do I really need stream_options include_usage if I only use streaming for the UX?
- Yes, if you want token counts for those calls. On OpenAI-compatible APIs the flag is the only thing that makes the API emit a usage payload for a streamed response. Without it there is no partial accounting to fall back on. Anthropic is different: it always reports usage in the trailing message_delta for a stream that runs to completion, so there is no flag to set, only a stream to finish reading.
- What happens to the numbers when a user closes the tab mid-response?
- The provider generated the tokens it generated and billed you for them. Your side stops receiving events, so the final usage payload never arrives and the call records no tokens. This gets worse the longer your responses are, because a longer response gives the user more time to leave. Consuming the stream server-side and forwarding from your own buffer decouples your accounting from their connection.
- Can I recover the token counts for calls that already happened?
- No. The provider reported them once, in a payload you did not receive, and there is no retrieval API for a past call's usage. That is why the estimate is sized from the median of your completed streams for the same model instead of looked up. Going forward you can capture them properly; backwards you can only bound the gap.
- Does a missing usage payload mean the call failed?
- Not usually. The generation ran and content was delivered. What failed was the accounting handshake at the end. That is precisely why it is invisible: there is no error and no alert, and the span looks healthy apart from four empty number columns.
Further reading
- Is that a bill, or a list price?. The other direction of the same class of problem, where a figure is present and means something different from what it says.
- Why subagent token counts are wrong. Counts that are too high rather than absent, from replaying a shared prefix per child.
TokenJam is a local-first, OTel-native cost layer for AI agents. No cloud, no signup. pipx install tokenjam, then tj optimize stream-usage to see whether any of your streamed calls landed without their token counts.