AI Spend Backfill: Why Your ROI Dashboard Shows a Year of Output and Two Weeks of Cost
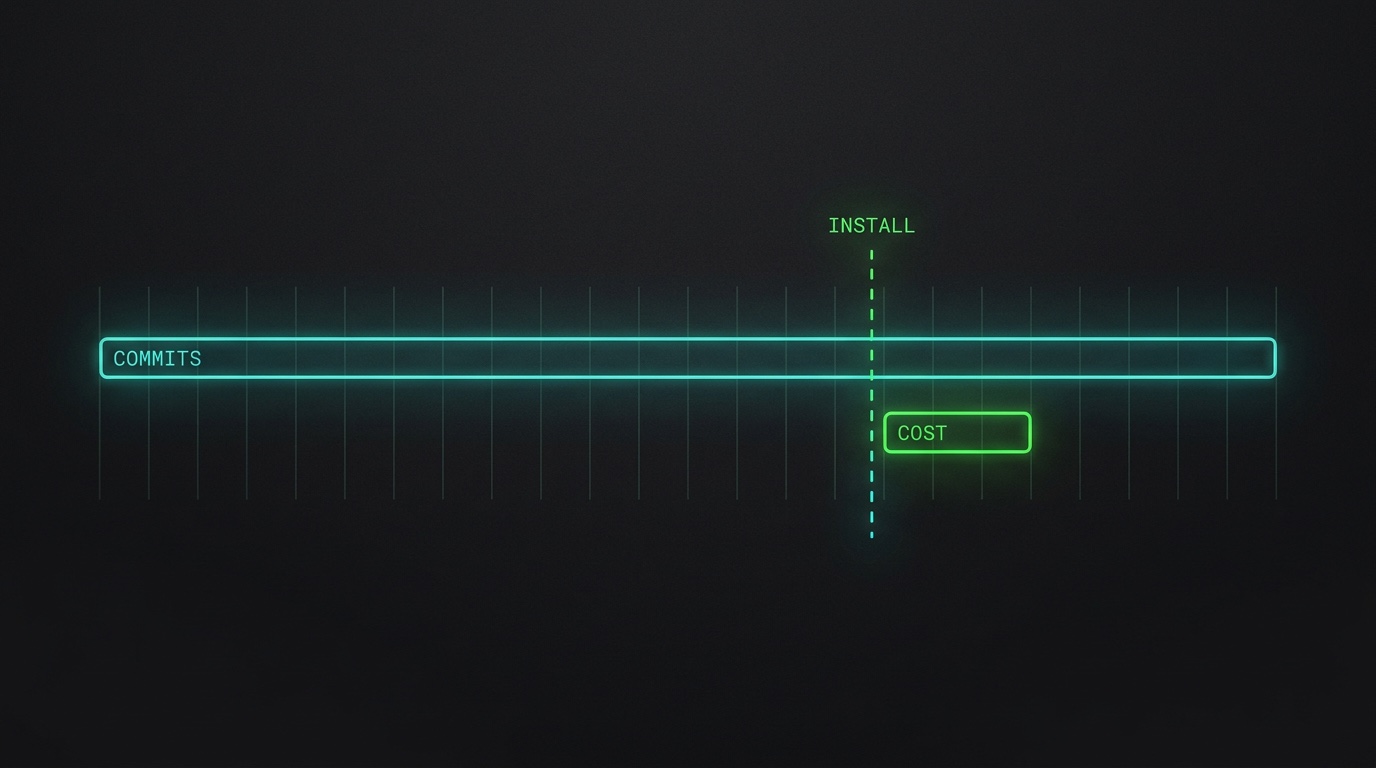
You connect an AI-ROI dashboard on a Monday. The repo integration finishes in about ninety seconds, because reading git is a clone and a walk, and the output side of the page fills in immediately: 1,400 commits, 310 merged pull requests, twelve months of weekly bars. The cost side shows a stub against the right-hand edge of the same axis.
By Friday there is a number in the corner of the page. Cost per merged pull request: $1.12.
That figure is built from four days of spend over twelve months of merges. It is not an estimate of anything. It is a unit conversion between two different time periods, wearing a dollar sign. (Those numbers are invented for the arithmetic. The shape is not.)
Why does the output side go back a year and the cost side start today?
Because one of them is a durable artifact and the other is an observation.
A commit is a permanent record that your team created on purpose and then preserved on purpose. It has a timestamp, an author, a diff, a parent. It was written to be read later, by people who were not there. A tool connecting to your repository today inherits every one of those records for free, and the reason integrating git feels instant is that there is nothing to collect. The data was already finished.
Agent cost is the opposite shape. It exists as a property of a request that happened at a moment in time, and unless something was watching when the request went out, the event leaves no artifact behind. A provider billed you and the response arrived. There is no row anywhere keyed to a repository, a session or a commit that says what it cost.
That is why every cost integration in this category is forward-only. A collector you install on Monday observes Monday onward. Three common shapes, all with the same start date:
- An OpenTelemetry endpoint that your agent exports to. It carries the request that happens after you set the environment variable, and has nothing to say about last quarter.
- A proxy or gateway your traffic routes through. Same boundary. It moves from a config file to a network route.
- A provider billing connector. This one gets you further back, as far as the invoice history runs, at a grain of account and day and model. No session, no commit. You cannot join it to the output side at all, which is a different problem with its own post.
So the asymmetry is structural. It is not a gap in anybody’s product roadmap.
What breaks when you divide across the gap
Three artifacts, in ascending order of how much damage they do.
The unit cost reads too cheap. This is the obvious one. A total spend taken from a partial window, divided by a count of output taken from the full window, produces a number that is low by roughly the ratio of the two periods. Four days over twelve months is a factor of about ninety. Nobody will question a flatteringly small figure, which is what makes it dangerous; if the same arithmetic had produced $100 per pull request somebody would have gone looking for the bug by lunchtime.
The trend line is the collector, not your spending. Week one of a new integration always ramps. Agents get instrumented one at a time, and somebody connects the second repo in week three. Spend rises on the chart every week for about a month and then flattens, and none of that shape is behaviour. Treating the first month’s slope as a forecast input is how a team ends up explaining a month-over-month increase that was coverage arriving.
The baseline is not a baseline. This is the expensive one, and it is the one that survives into a slide deck.
The standard ROI framing wants a period before the spending started, so you can compare. Your dashboard appears to offer one: the twelve months to the left of the start date show zero AI cost, which is exactly the shape a pre-AI period has. Those months were not pre-AI. Your team was using coding agents through all of them. What the window records is zero observation, and the chart draws absence and zero in the same colour.
Divide the “after” by the “before” and you have measured the installation date of a collector. A slide that says cost per unit of output rose 30× after adopting AI is reporting, correctly, that it had no data before.
How wide is my gap, exactly?
Two dates and one subtraction. You can usually get both out of a tool you already have.
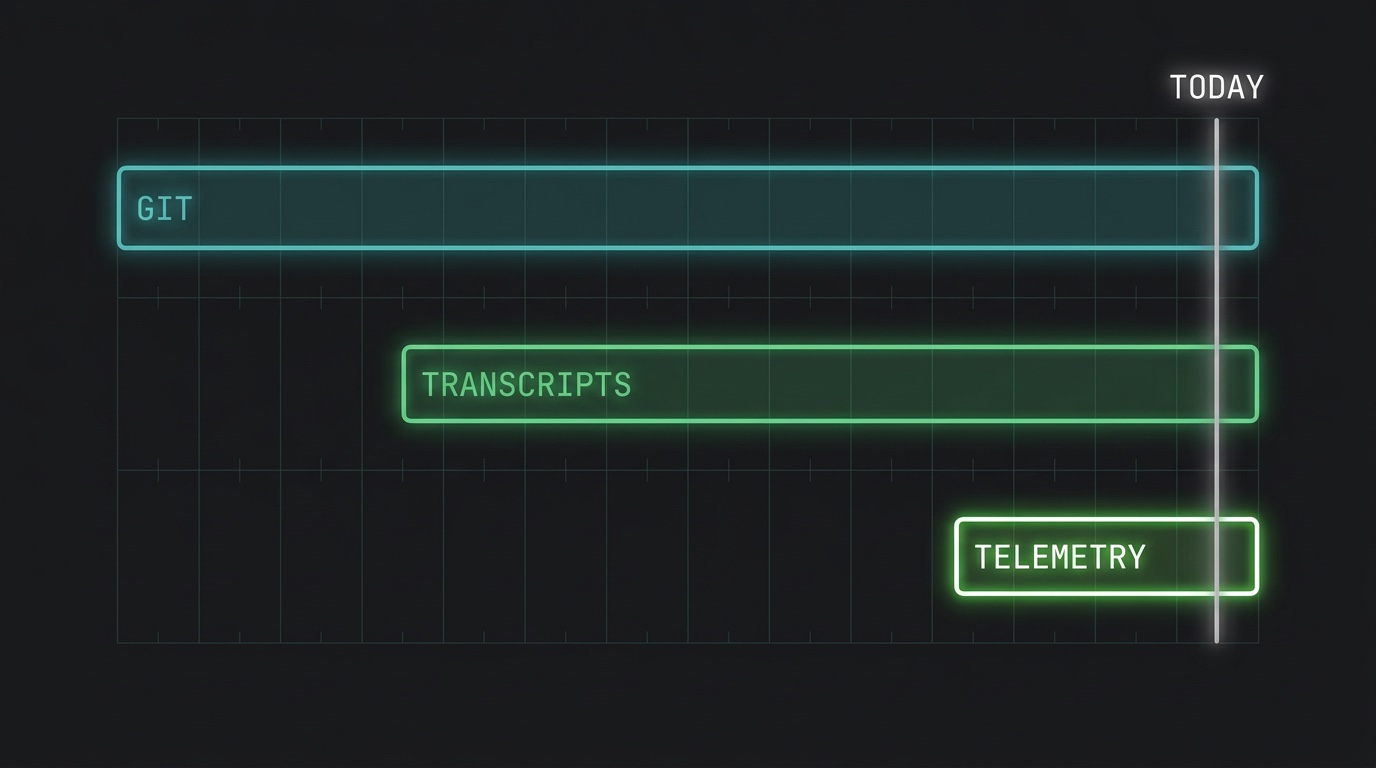
The earliest output. The first commit in the window a figure is computed over, which in most dashboards is whatever range the date picker is set to. A default of “last 12 months” quietly recruits eleven months of un-costed output into every denominator on the page.
The earliest cost. The first timestamp in the spend series. Ask for it as a date. If the answer is the day you connected, you know the shape you are looking at.
Then stop using any ratio whose two halves do not share a window. The fix is not complicated. Restrict both sides to the overlap and the figures become real, at the cost of being computed over a fortnight. Make that trade deliberately. The page will otherwise make it for you.
What can actually be recovered retroactively?
Only evidence that already exists in a file. That rules out anything the network dropped, and it leaves one source that turns out to be surprisingly good: the log the agent wrote for its own reasons.
Coding agents keep local session transcripts so they can resume a conversation, and those transcripts carry the accounting as a side effect. Claude Code writes newline-delimited JSON per session under ~/.claude/projects/, one object per message, and each assistant message carries message.model plus a message.usage block with input tokens, output tokens, cache reads and cache writes. Codex writes a rollout file per session under ~/.codex/sessions/, where a token_count event reports the per-turn delta. Both also record the working directory the session ran in, which is what makes a repository join possible after the fact.
None of that was deployed. It is the agent’s own bookkeeping, written to disk months ago, sitting there in full detail.
That is the one retroactive cost path, and it is why we parse those files rather than asking you to install a recorder and wait. tj backfill claude-code and tj backfill codex walk the on-disk history, recompute cost from a rate card, and write deterministic span ids so re-running ingests no duplicates. tj onboard does the last 30 days by default so first run finishes while you are still watching, and the full history is one command away.
What a backfill cannot give you back
A retroactive cost side does not make the two halves symmetric, and anyone telling you it does has not read the files.
It reaches back as far as the transcripts do, and no further. Agents prune their own session logs on a retention setting. Whatever has aged out is gone, and the practical horizon is measured in months. That horizon is also not uniform: it depends on how long each machine has had the agent installed, so a team’s recoverable window is the ragged union of several personal ones.
It only covers the agents that keep a local log. A session run through your own code, or a hosted agent whose traffic never touched a machine you control: no file, nothing to parse. For those, forward-only is the only option there has ever been.
The dollar figure is a reconstruction. What is on disk is token counts. The cost is computed from those counts at a published rate card, which is a price and not a charge, and on a subscription seat it is not what you paid at all. That gap deserves its own careful treatment and gets it here.
Prompt and tool content stays out unless you ask for it. Backfill is token counts and metadata by default. The text of what was said is behind an explicit capture setting, off by default, and recovering it later means a deliberate re-ingest.
So the honest claim is narrow. Some of the cost history can be rebuilt from files you already have, for the agents that wrote them, as far back as those files survive, at list price. That is a much better starting point than a stub against the right-hand edge. It is not a year.
Two questions for whoever is selling you the dashboard
Worth asking on the call, because the answers sort vendors quickly.
What date does my cost series start, and what do you do with output that predates it? There are three defensible answers. Exclude that output from every denominator. Shade it as out of coverage. Recover it from a local source and say how far back the recovery got. The answer that should worry you is a page that silently renders those months at zero.
Is there any path to cost before the install date, and what is it made of? A provider invoice gets you history at account grain, which does not join to a commit. A local agent log gets you history at session grain, which does. Nothing gets you a session-grain cost for a request nobody recorded and no agent logged. A vendor who says that plainly is a vendor who has looked.
Common questions
- Can I just backfill my provider invoices and be done with it?
- You will get real history and you will not be able to join it to anything. Invoices are keyed by account, day and model. Your output is keyed by commit. There is no shared column, so the only way to combine them is to allocate a daily total across whatever each person touched that day. That is an apportionment. It is fine for a monthly finance view and it cannot tell you what one pull request cost.
- How long until the gap stops mattering?
- Once your cost series is longer than the window you compute over. If you report on a rolling 90 days, you are clean after 90 days of collection. A team quoting a trailing-twelve-month figure waits a year. This is the main argument for picking a short reporting window at the start and widening it as coverage grows, instead of starting with the window you eventually want.
- My dashboard shows AI cost for months before we installed anything. How?
- Two likely explanations and they are very different. Either it connected to a provider billing API, in which case the figure is real history at account grain and cannot be attributed to a repository, or it is allocating a recent rate backwards across old output, in which case the early months are a model rather than an observation. Ask which. Backwards allocation is not illegitimate, and presenting it in the same cell as measured spend is.
- Does the gap go away if I only look at cost, not ROI?
- Mostly, yes. A pure spend view over the collected window is sound on its own terms, because both the numerator and the period come from the same source. The trouble starts when output joins the page, since output arrived with a year of history and cost did not.
- Is it worth backfilling at all if the horizon is only a few months?
- A few months is the difference between a trend and a dot. It also tends to be where the useful findings are: a model choice nobody revisited, or a workflow somebody set up in March and has not looked at since. None of those are visible in two weeks of data. Check what is actually on disk before deciding, since the answer varies by machine.
Further reading
- Is that a bill, or a list price?. What a reconstructed dollar figure is made of, and why a rate card is not a charge.
- AI commit attribution: how accurate is the cost on a pull request?. The other half of the join, once both sides cover the same period.
- Unshipped burn. What the sessions that produced no commit cost, which is a figure the output side cannot see at all.
TokenJam is a local-first, OTel-native cost layer for AI agents. No cloud, no signup. pipx install tokenjam, then tj backfill claude-code to see how far back your own session history actually reaches.