Where Does Your Claude Code Quota Actually Go?
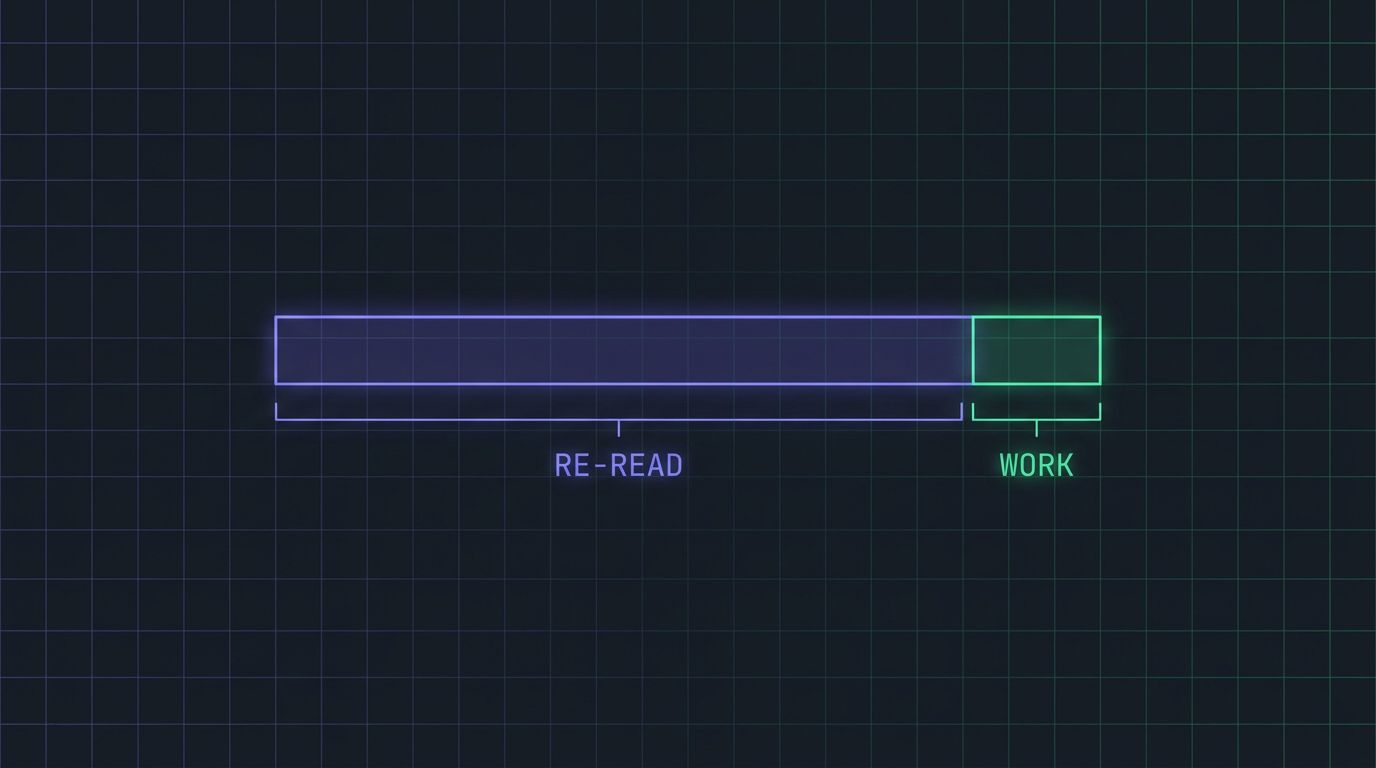
The moment your five-hour window dies mid-task is the moment you realize you have no idea where it went. You were three files into a refactor. /status said you had runway an hour ago. Now the session is frozen behind a usage limit and the work is half-done. You have a strong hunch about the cause, a 12,000-word CLAUDE.md, a couple of MCP servers injecting fat schemas on every call, a pile of globally-installed skills that reload each turn, but a hunch is not a measurement. So you reach for /compact, watch it flatten the session into something lossy, and get back to work with less context and no more understanding than before.
I have been digging into this failure across dozens of GitHub threads, and the pattern is remarkably consistent. Max 20x users describe going from “21% to 100% usage on a single prompt” (#42249). Five-hour windows evaporate in 19 to 90 minutes of what people insist is normal usage (#38335). The complaint underneath all of them is the same: the cut-off arrives with no warning and no cause. You get a wall, not an explanation.
Quota is the unit, and nothing measures it right
If you are on Pro or Max, the dollar tools are pointed at the wrong target. /cost estimates an API bill you will never be charged, which is why the community keeps telling subscription users to ignore it. The reporters that the ecosystem actually runs, ccusage and Claude-Code-Usage-Monitor among them, are genuinely useful for totals and burn rate. They answer “how much” and “how soon.” Neither answers the question that determines whether you finish your task: how much of that burn was real work?
That distinction matters because the two costs behave differently. Work is the tokens spent generating the diff, running the tool, reasoning about the next step. It scales with the task. Re-reading context is the tax you pay to bring the model back up to speed on every single turn: the full CLAUDE.md, the tool definitions, the MCP schemas, the output of the last twelve tool calls, resent so the model has them in view again. It scales with your setup, and it compounds on every turn whether the turn accomplished anything or not.
The 99.93% finding
The sharpest evidence I have seen for this comes from a developer who got tired of guessing. They pulled 30 days of their own Claude Code JSONL transcripts and parsed them by hand to see where the tokens went. The answer, filed as anthropics/claude-code #24147: re-reads of a single CLAUDE.md file accounted for 99.93% of their quota. Almost none of their window was buying new work. Nearly all of it was re-loading the same instructions, turn after turn.
Sit with the shape of that. Not a corner case, not a misconfigured edge. A normal setup and a normal file. A background tax so large it drowned out everything the sessions were actually built to do. The person only found it because they wrote a custom script and read a month of raw logs. The information was sitting on their disk the entire time. Nothing surfaced it.
That is the gap. The data exists, in plain JSONL, in ~/.claude/projects/. What is missing is a tool that reads it and renders the split.
Why /compact makes this worse, not better
When the wall hits, /compact is the reflex. It is also the worst possible instrument for diagnosis, for three reasons.
- It is reactive. It fires when you are already saturated, long after the quota is spent. It cannot prevent the burn it is responding to.
- It is blind. It compresses by summarizing, with no model of which context was expensive or which was load-bearing. People describe the result as a lobotomy: the session forgets which files it had been editing.
- It destroys the evidence. The record of what was bloating your context, the very thing you would inspect to fix the problem, is the thing compaction throws away first.
So the standard loop is: burn quota invisibly, hit the wall, compact away the proof, repeat tomorrow. You never get a turn where you can see the composition and change it. If you have read our earlier pieces on why cost dashboards only tell you the bill and the trouble with tokenmaxxing, this is the same gap in a subscription costume: reporting is not diagnosis, and blind optimization is not understanding.
What changes: a per-turn composition view, locally
Here is the workflow that replaces that loop, and you can run it today. Instead of hitting the wall and guessing, you run one local command and read a composition card for the session: this many tokens went to re-reading context, this many to new work, broken down by what drove the re-reads, the CLAUDE.md, the MCP schemas, the accumulated tool output. It also names the files you re-read every turn and the sections worth compacting. Not a total. A cause. The number the #24147 developer had to hand-derive, rendered for you off the transcripts already on your disk.
That diagnostic is tj context, and it ships now. Install TokenJam and run it:
pipx install tokenjam
tj context
If you would rather not install anything, npx tokenjam and uvx --from tokenjam tj run the same command.
tj context does not stand alone. Session Story ships too: a local, read-only timeline that reconstructs what each session did, and, when you run agents, what each subagent did, from the raw JSONL. This is the answer to leaving five agents running overnight and having no idea what they touched. It also carries per-subagent attribution that ccusage gets wrong on exactly this axis: its subagent token counts have been shown off by as much as 91x because they replay the parent thread (#950). An MCP server ships too, for SDK/API integrations that want these findings inside the agent loop; Claude Code onboarding does not wire it in by default, since an in-loop MCP server is a real quota cost on every turn, so on Claude Code you read findings via the CLI or the statusline instead.
The honest part of build-in-public here is not a roadmap caveat. It is the boundary of what the tool does: tj context is read-only and fully local. It diagnoses the composition and points at the expensive files; you decide what to trim. It never edits your CLAUDE.md. It never touches your config or sends your transcripts anywhere. TokenJam reads the JSONL Claude Code already writes, on your machine, and stops there. For the longer argument about why the meaningful number is quota composition rather than a dollar figure, the earlier breakdown of where your agent bill actually goes lays out the five waste patterns underneath, and how to monitor Claude Code covers the raw-transcript ground this all reads from.
Install with pipx install tokenjam and run tj context to see your own per-turn split, plus tj quota-audit for plan-tier-aware quota reporting. This is the view that started the project, and it is live.
Common questions
- Why did my 5-hour window vanish in 20 minutes when I barely did anything?
- Because 'barely did anything' still pays the context tax on every turn. If your CLAUDE.md is large, your MCP servers inject fat schemas, and tool output is piling up, each turn re-reads all of it before doing any new work. A short, low-effort session can still burn a huge share of quota on re-reads alone. The only way to confirm it for your setup is to see the per-turn split, which is exactly what 'tj context' renders. Run 'pipx install tokenjam' then 'tj context' to see yours.
- Isn't this just what /cost or ccusage already show me?
- No. Those show totals and burn rate: how much you spent and how fast. They do not show composition, meaning how much of each turn went to re-reading context versus doing new work. Two sessions can burn identical totals while one is mostly real work and the other is mostly re-reads. The total looks the same. The fix is completely different. Composition is the number no other tool renders, and it is exactly what 'tj context' shows.
- Does TokenJam send my code or transcripts anywhere?
- No. It is 100% local. It reads the JSONL that Claude Code already writes under your home directory, runs the analysis on your machine, and never phones home. There is no signup and no account. No cloud. 'tj context', Session Story, and the MCP server all work this way today. 'tj context' is read-only: it diagnoses the composition and points at the expensive files, but it never edits your CLAUDE.md or config.
- Should I just delete my CLAUDE.md to save quota?
- Probably not, and that is the point of measuring first. A large CLAUDE.md that genuinely steers the model earns its cost. A large one whose bulk is re-read every turn without changing outcomes does not. Deleting blind is a guess in either direction. Run 'tj context' first: it shows the composition and flags the recurring re-read files, so you can trim the sections that cost the most for the least benefit specifically.
- What can I actually use today?
- All of it. 'tj context', the per-turn re-read-versus-work composition view this post centers on, is available today: run 'pipx install tokenjam' then 'tj context'. Also available today: Session Story, the local timeline of what every session and subagent did, with per-subagent attribution; 'tj quota-audit' for plan-tier-aware quota reporting; and an MCP server for SDK/API integrations that want findings inside the agent loop (Claude Code onboarding does not wire this one in, by design). Everything runs on the same local, read-only transcript data.
- I run a bunch of agents at once and have no idea what they did. Does this help?
- Yes, and that is what Session Story is for today. It reconstructs a local timeline of each session and each subagent from the raw transcripts, so you can replay what an overnight or multi-agent run actually touched. It also fixes the subagent miscounting that trips up other reporters, which replay the parent thread and can be off by a large factor. You get an accurate per-subagent picture instead of one inflated blended number.